Quantifying similarity between motifs - PubMed (original) (raw)
Quantifying similarity between motifs
Shobhit Gupta et al. Genome Biol. 2007.
Abstract
A common question within the context of de novo motif discovery is whether a newly discovered, putative motif resembles any previously discovered motif in an existing database. To answer this question, we define a statistical measure of motif-motif similarity, and we describe an algorithm, called Tomtom, for searching a database of motifs with a given query motif. Experimental simulations demonstrate the accuracy of Tomtom's E values and its effectiveness in finding similar motifs.
Figures
Figure 1
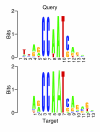
An aligned pair of similar motifs. The query and target motifs are both derived from JASPAR motif NF-Y, following the simulation protocol described in the text. Tomtom assigns an E value of 3.81 × e-10 to this particular match. The figure was created using a version of seqlogo [26], modified to display aligned pairs of Logos.
Figure 2
Score distribution histogram for a query motif of length 12. The figure contains 12 histograms overlaid on top of each other. Each histogram corresponds to the frequency distribution of scores, for an offset of zero relative to a query motif of width 12. The first (red) histogram is for the alignment involving only the first query column, the next (light green) histogram relates to the first two query columns, and so on.
Figure 3
Accuracy of motif comparison P values. The figure plots the computed motif P value as a function of the empirical (rank-based) P value from searching shuffled query motifs against shuffled target motifs. The central line corresponds to y = x, and the two adjacent dotted lines correspond to y = 0.5_x_ and y = 2_x_. The P values are computed using the euclidean distance.
Figure 4
Measuring retrieval accuracy. Motif retrieval accuracy is estimated using simulated JASPAR motifs, as described in the text. The figure plots the percentage of correct query-target pairs (true positives) as a function of the percentage of incorrect pairs (false positives) as we traverse the list of query-target pairs sorted by Tomtom P value or any of the other three methods of combining column-wise scores. The solid and dashed lines correspond to width-normalized scores scores (P values, arithmetic mean, and geometric mean), and the green dotted line represents sum of column scores. This figure is for euclidean distance (ED) at a sampling rate of S/8.
Figure 5
E value based retrieval rate. The figure plots the percentage of query motifs that successfully matched the correct JASPAR target as a function of the number of sites used to create the query motif. Here 'success' means that the top-ranked motif is the correct target and has an E value less than 0.01. ALLR, average log-likelihood ratio; ED, euclidean distance; FIET, Fisher-Irwin exact test; KLD, Kullback-Leibler divergence; PCC, Pearson correlation coefficient; PCST, Pearson _χ_2 test; SW, Sandelin-Wasserman function.
Similar articles
- GADEM: a genetic algorithm guided formation of spaced dyads coupled with an EM algorithm for motif discovery.
Li L. Li L. J Comput Biol. 2009 Feb;16(2):317-29. doi: 10.1089/cmb.2008.16TT. J Comput Biol. 2009. PMID: 19193149 Free PMC article. - Discovering sequence motifs.
Bailey TL. Bailey TL. Methods Mol Biol. 2008;452:231-51. doi: 10.1007/978-1-60327-159-2_12. Methods Mol Biol. 2008. PMID: 18566768 Review. - MODSIDE: a motif discovery pipeline and similarity detector.
Tran NTL, Huang CH. Tran NTL, et al. BMC Genomics. 2018 Oct 19;19(1):755. doi: 10.1186/s12864-018-5148-1. BMC Genomics. 2018. PMID: 30340511 Free PMC article. - The value of position-specific priors in motif discovery using MEME.
Bailey TL, Bodén M, Whitington T, Machanick P. Bailey TL, et al. BMC Bioinformatics. 2010 Apr 9;11:179. doi: 10.1186/1471-2105-11-179. BMC Bioinformatics. 2010. PMID: 20380693 Free PMC article. - Computational identification and analysis of protein short linear motifs.
Davey NE, Edwards RJ, Shields DC. Davey NE, et al. Front Biosci (Landmark Ed). 2010 Jun 1;15(3):801-25. doi: 10.2741/3647. Front Biosci (Landmark Ed). 2010. PMID: 20515727 Review.
Cited by
- OVO positively regulates essential maternal pathways by binding near the transcriptional start sites in the Drosophila female germline.
Benner L, Muron S, Gomez JG, Oliver B. Benner L, et al. Elife. 2024 Sep 18;13:RP94631. doi: 10.7554/eLife.94631. Elife. 2024. PMID: 39291827 Free PMC article. - 29 mammalian genomes reveal novel exaptations of mobile elements for likely regulatory functions in the human genome.
Lowe CB, Haussler D. Lowe CB, et al. PLoS One. 2012;7(8):e43128. doi: 10.1371/journal.pone.0043128. Epub 2012 Aug 27. PLoS One. 2012. PMID: 22952639 Free PMC article. - Sequence features and chromatin structure around the genomic regions bound by 119 human transcription factors.
Wang J, Zhuang J, Iyer S, Lin X, Whitfield TW, Greven MC, Pierce BG, Dong X, Kundaje A, Cheng Y, Rando OJ, Birney E, Myers RM, Noble WS, Snyder M, Weng Z. Wang J, et al. Genome Res. 2012 Sep;22(9):1798-812. doi: 10.1101/gr.139105.112. Genome Res. 2012. PMID: 22955990 Free PMC article. - Transcriptomic characterization of Trichoderma harzianum T34 primed tomato plants: assessment of biocontrol agent induced host specific gene expression and plant growth promotion.
Aamir M, Shanmugam V, Dubey MK, Husain FM, Adil M, Ansari WA, Rai A, Sah P. Aamir M, et al. BMC Plant Biol. 2023 Nov 8;23(1):552. doi: 10.1186/s12870-023-04502-6. BMC Plant Biol. 2023. PMID: 37940862 Free PMC article. - Predicting gene regulatory regions with a convolutional neural network for processing double-strand genome sequence information.
Onimaru K, Nishimura O, Kuraku S. Onimaru K, et al. PLoS One. 2020 Jul 23;15(7):e0235748. doi: 10.1371/journal.pone.0235748. eCollection 2020. PLoS One. 2020. PMID: 32701977 Free PMC article.
References
MeSH terms
LinkOut - more resources
Full Text Sources
Other Literature Sources


