Thermosensitive TRPV channel subunits coassemble into heteromeric channels with intermediate conductance and gating properties - PubMed (original) (raw)
Comparative Study
Thermosensitive TRPV channel subunits coassemble into heteromeric channels with intermediate conductance and gating properties
Wei Cheng et al. J Gen Physiol. 2007 Mar.
Abstract
Heat-sensitive transient receptor potential (TRP) channels (TRPV1-4) form the major cellular sensors for detecting temperature increases. Homomeric channels formed by thermosensitive TRPV subunits exhibit distinct temperature thresholds. While these subunits do share significant sequence similarity, whether they can coassemble into heteromeric channels has been controversial. In the present study we investigated the coassembly of TRPV subunits using both spectroscopy-based fluorescence resonance energy transfer (FRET) and single-channel recordings. Fluorescent protein-tagged TRPV subunits were coexpressed in HEK 293 cells; FRET between different subunits was measured as an indication of the formation of heteromeric channels. We observed strong FRET when fluorescence signals were collected selectively from the plasma membrane using a "spectra FRET" approach but much weaker or no FRET from intracellular fluorescence. In addition, no FRET was detected when TRPV subunits were coexpressed with members of the TRPM subfamily or CLC-0 chloride channel subunits. These results indicate that a substantial fraction of TRP channels in the plasma membrane of cotransfected cells were heteromeric. Single-channel recordings confirmed the existence of multiple heteromeric channel forms. Interestingly, heteromeric TRPV channels exhibit intermediate conductance levels and gating kinetic properties. As these subunits coexpress both in sensory neurons and in other tissues, including heart and brain, coassembly between TRPV subunits may contribute to greater functional diversity.
Figures
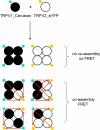
Figure 1.
Schematic diagram illustrating the strategy for the FRET experiment. Large circles represent TRPV channel sub units. Small cyan and yellow circles represent Cerulean and eYFP, respectively. Red arrows indicate FRET pathways.
Figure 2.
The FRET model. (A) The expected efficiency of energy coupling through various possible pathways within a fourfold symmetric complex. (B) FRET efficiency of each channel type with different subunit stoichiometry (solid curves). For comparison, the FRET efficiency of a single donor–acceptor pair is shown in dotted curve. C, Cerulean; Y, eYFP. (C) The relationship between the fluorescence intensity ratio and the distribution of each channel type (dotted curves) as well as the overall FRET efficiency from all channel populations (solid curve). The value for E is set at 25% for this simulation. Notice that the FRET efficiency curve exhibits significant sigmoidicity and reaches a plateau level much higher than 25%.
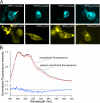
Figure 3.
Fluorescence recordings of TRPV expressed in HEK 293 cells. (A) Example cells expressing each of the fluorophore-tagged TRPV subunits. The red and white arrows in the top left panel indicate fluorescence signals from the plasma membrane and the intracellular structures, respectively. (B, top) Emission spectra recorded from the same TRPV1_Cerulean- expressing cell shown in A. (B, bottom) The difference between the plasma and intracellular spectra. Significant difference is observed in the 520–540-nm range, which corresponds to the eYFP peak emission.
Figure 4.
Spectra FRET. A single HEK 293 cell coexpressing TRPV3_Cerulean and TRPV3_eYFP was observed with CFP (A) or YFP (D) excitation. Spectroscopic images from the region under the slit (indicated by the rectangle) were recorded with each excitation (B and E). In the spectroscopic images, the Y axis represents the position of the cell, the X axis represents the wavelength. The fluorescence intensity values measured from the upper membrane region (indicated by a box) are shown in C and F. Notice the bright strips in B and E between the membrane signals, which represent fluorescence from intracellular sources. (G) Colocalization of di-8-ANEPPS, a plasma membrane marker fluorophore (red, left), and TRPV2_Cerulean (cyan, middle). In the overlay image (right), Cerulean fluorescence is shown in green.
Figure 5.
FRET measurements from homomeric TRPV channels. The FRET efficiency measured from cells expressing TRPV3_Cerulean/TRPV3_eYFP (A) or TRPV2_Cerulean/TRPV2_eYFP (B) is plotted as a function of the fluorescence intensity ratio between Cerulean and eYFP. Each symbol represents a single cell. The solid curve represents the FRET model that yields the best fit; dotted curves represent models with 5% higher or lower FRET efficiencies.
Figure 6.
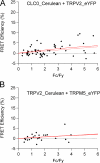
Measurements from cells coexpressing CLC-0_Cerulean/TRPV2_eYFP (A) and TRPV2_Cerulean/TRPM5_eYFP (B), which serve as negative controls. The dotted lines represent a linear fit to the dataset; the solid curves represent fits of the FRET model to the dataset.
Figure 7.
FRET measurements from heteromeric TRPV channels. The FRET efficiency measured from cells expressing TRPV1_Cerulean/TRPV2_eYFP (A), TRPV4_Cerulean/TRPV1_eYFP (B), TRPV1_Cerulean/TRPV3_eYFP (C), and TRPV2_Cerulean/TRPV4_eYFP (D) is plotted as a function of the fluorescence intensity ratio between Cerulean and eYFP. Each symbol represents a single cell. The solid curve represents the FRET model that yields the best fit; dotted curves represent models with 5% higher or lower FRET efficiencies.
Figure 8.
The relationship between the FRET efficiency and the sequence similarity. The dotted line, at the 8.4% level, corresponds to the lower boundary of the FRET efficiency range for the homomeric channels. The gray area represents the background level of nonspecific FRET.
Figure 9.
FRET detected from the plasma membrane. For each cell, FRET was estimated from both the plasma membrane (solid symbols) and the intracellular region (open symbols) and labeled as Mn and In, respectively, where n represents the cell identification number. The red solid and dotted curves represent the fit of the FRET model to the two datasets, respectively. The black dotted curve represents the background level, as seen in Fig. 6 A.
Figure 10.
TRPV1 homomeric channels. (A) Representative single-channel traces recorded at +80, +60, and +40 mV. (B) All-point histograms at each voltage. The red curves are fits of a double-Gaussian function. (C, left) A kinetic model used in hidden Markov modeling analysis of the gating properties, with transition rates, in s−1, determined from single-channel recordings at +80 mV. The burst duration calculated from this model is 14.8 ms. Also shown is a representative single-channel trace with idealization (red) overlaid on top. (C, middle, right) Histograms of the closed and open durations. Curves are fits of Gaussian functions.
Figure 11.
TRPV3 homomeric channels. (A) Representative single-channel traces recorded at +80, +60, and +40 mV. (B) All-point histograms at each voltage. The red curves are fits of a double-Gaussian function. (C) A kinetic model used in HMM analysis of the gating properties. The burst duration calculated from this model is 53.5 ms.
Figure 12.
Representative heteromeric channel formed with TRPV1 and TRPV3 subunits. (A) Representative single-channel traces recorded at +80, +60, and +40 mV. (B) All-point histograms at each voltage. The red curves are fits of a double-Gaussian function. (C) A kinetic model used in HMM analysis of the gating properties. The burst duration calculated from this model is 24.0 ms.
Figure 13.
Comparison of homomeric and heteromeric TRPV channels. (A) Representative current traces recorded at +80 mV from cells cotransfected with TRPV1 and TRPV3. (B) All-point histograms constructed from single-channel recordings of each channel type. The red curves are fits of a double-Gaussian function. Shown on the left are possible subunit stoichiometries; open and filled circles represent the TRPV1 and TRPV3 subunits, respectively.
Figure 14.
The frequency of recording each channel type from cells cotransfected with TRPV1 and TRPV3. Superimposed is a fit of a binomial function, with the probability of incorporating a TRPV1 subunit being 65.5%.
References
- Ahluwalia, J., H. Rang, and I. Nagy. 2002. The putative role of vanilloid receptor-like protein-1 in mediating high threshold noxious heat-sensitivity in rat cultured primary sensory neurons. Eur. J. Neurosci. 16:1483–1489. - PubMed
- Amiri, H., G. Schultz, and M. Schaefer. 2003. FRET-based analysis of TRPC subunit stoichiometry. Cell Calcium. 33:463–470. - PubMed
- Arniges, M., J.M. Fernandez-Fernandez, N. Albrecht, M. Schaefer, and M.A. Valverde. 2006. Human TRPV4 channel splice variants revealed a key role of ankyrin domains in multimerization and trafficking. J. Biol. Chem. 281:1580–1586. - PubMed
- Bykova, E.A., X.-D. Zhang, T.-Y. Chen, and J. Zheng. 2006. Large movement in the C terminus of CLC-0 chloride channel during slow gating. Nat. Struct. Mol. Biol. 13:1115–1119. - PubMed
- Caterina, M.J., and D. Julius. 2001. The vanilloid receptor: a molecular gateway to the pain pathway. Annu. Rev. Neurosci. 24:487–517. - PubMed
Publication types
MeSH terms
Substances
LinkOut - more resources
Full Text Sources
Research Materials
Miscellaneous


