Focal adhesion kinase modulates tension signaling to control actin and focal adhesion dynamics - PubMed (original) (raw)
Focal adhesion kinase modulates tension signaling to control actin and focal adhesion dynamics
Markus Schober et al. J Cell Biol. 2007.
Abstract
In response to alphabeta1 integrin signaling, transducers such as focal adhesion kinase (FAK) become activated, relaying to specific machineries and triggering distinct cellular responses. By conditionally ablating Fak in skin epidermis and culturing Fak-null keratinocytes, we show that FAK is dispensable for epidermal adhesion and basement membrane assembly, both of which require alphabeta1 integrins. FAK is also dispensible for proliferation/survival in enriched medium. In contrast, FAK functions downstream of alphabeta1 integrin in regulating cytoskeletal dynamics and orchestrating polarized keratinocyte migration out of epidermal explants. Fak-null keratinocytes display an aberrant actin cytoskeleton, which is tightly associated with robust, peripheral focal adhesions and microtubules. We find that without FAK, Src, p190RhoGAP, and PKL-PIX-PAK, localization and/or activation at focal adhesions are impaired, leading to elevated Rho activity, phosphorylation of myosin light chain kinase, and enhanced tensile stress fibers. We show that, together, these FAK-dependent activities are critical to control the turnover of focal adhesions, which is perturbed in the absence of FAK.
Figures
Figure 1.
Intact basement membrane, surface integrins, and cell adhesion in keratinocytes lacking FAK. (A, A′, and C) FAK and the dermo–epidermal junction. Newborn WT and K14-Cre/Fakfl/fl cKO skin sections were subjected to immunofluorescence microscopy with the antibodies shown. Antibodies are color coded according to secondary antibodies. Dotted line demarcates the boundary between epidermis (Epi) and dermis (Derm). Areas in white boxes (A) are magnified in A′. β1, β1 integrin; Lam 5, laminin 5; DNA, DAPI staining; HP, hair placode; BL, basal layer. (B) Immunoblot of epidermal cell lysates. Blots were probed with the following antibodies: FAK, pY397-FAK (p-FAK), and β-actin (loading control). (D) Transmission EM (TEM) showing representative examples of WT and cKO epidermal–dermal borders. Note comparable morphology, size, and density of hemidesmosomes (Hd). BM, basement membrane. (E) Hemidesmosome length and frequency are not affected by loss of FAK. Box-and-whisker diagrams at left display the distribution of the data: mean (square), 25th percentile (bottom line), median (middle line), 75th percentile (top line), 5th and 95th percentile (whiskers), and minimum and maximum measurements (x). (See Fig. S2, available at
http://www.jcb.org/cgi/content/full/jcb.200608010/DC1
, for additional information.) Graph at right shows analyses of total micrometers of hemidesmosome per micrometer of basal plasma membrane. (F) FACS quantification of epidermal integrin surface levels. Surface-specific integrin antibodies used are indicated at bottom of each graph. Active β1 corresponds to a surface antibody that specifically recognizes the active configuration of β1, irrespective of α partner. Gray line indicates secondary antibody–only control. (G) Adhesion assays were performed as described in Materials and methods. Note comparable adhesion of WT and cKO keratinocytes to FN, laminin 1, collagen 4, and poly-
d
-lysine substrates. Error bars reflect SD of triplicate experiments.
Figure 2.
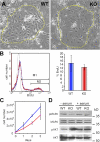
_Fak-_null keratinocytes proliferate well under optimal growth conditions. Primary MKs were cultured from Fak cKO and WT epidermis on a fibroblast feeder layer (A). Once colonies formed, feeders were selectively removed with Versene, and MKs were passaged in the absence of feeders for the subsequent studies (B–D). (A) Phase-contrast images of representative WT and Fak KO colonies on feeders. (B) Cell cycle analyses. BrdU was administered to the culture medium for 4 h followed by harvesting and FACS analyses. Note comparable cell cycle profiles and BrdU incorporation. (C) Growth curves. MKs were plated in serum-containing medium, and thereafter cells were harvested daily in triplicate and cells were counted. Error bars indicate SD. (D) Immunoblot analyses of MK lysates cultured in the presence or absence of serum for 24 h before harvesting. Antibodies used are shown at left; molecular masses of band sizes are indicated at right in kD.
Figure 3.
PYK2 and ILK still localize to FAs in _Fak-_null keratinocytes. Immunoblot analysis and immunofluorescence of WT and Fak KO MK (A) or WT and β1 KO MK (B). Antibodies used are as shown, except phalloidin (red) is used to mark F-actin, and DAPI (blue) labels nuclear chromatin. Phosphorylated versions of FAK and PYK2 are active. Antibodies are color coded according to the secondary antibodies used. Boxed areas are magnified and shown as insets in which phalloidin fluorescence has been omitted. Note that Fak KO MKs still display active PYK2 as well as FA-localized ILK.
Figure 4.
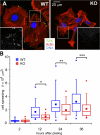
Keratinocytes lacking FAK display an exaggerated FA-actin stress fiber network and constricted cell morphology. (A) Immunofluorescence microscopy of representative MKs from WT and Fak cKO epidermis spread on FN for 48 h and labeled with anti-FAK (green), phalloidin (red), and DAPI (blue). Boxed areas are magnified in insets, which show only anti-FAK staining. (B) Box-and-whisker plot of cell spreading kinetics, indicating the mean (squares), 25th percentile (bottom line), median (middle line), 75th percentile (top line), 5th and 95th percentile (whiskers), and minimum and maximum measurements (x). Morphometric analyses of cell spreading were performed by measuring the average contact area between the cell and its substratum in square micrometers described in box-and-whisker diagrams. n ≥ 60 cells per time point. Asterisks indicate significant differences between WT and KO (t test). Note that differences in spreading increased over time. *, P = 0.025; **, P = 0.0018; ***, P = 0.0006.
Figure 5.
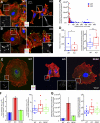
FAK-dependent differences in FA size and distribution. (A and B) Immunostaining of WT and _Fak_-KO keratinocytes for actin (red), nuclear chromatin (DAPI; blue), and FA markers VIN and PXN (green). (C) Scatter plot indicating the integrated fluorescence intensity of VIN-labeled FAs and their relative position from the cell cortex. (D) Box-and-whisker diagrams describing the distribution of FAs from the cortex to the center and the relative fluorescence intensity of VIN-labeled FAs. Box-and-whisker plots indicate the mean (squares), 25th percentile (bottom line), median (middle line), 75th percentile (top line), 5th and 95th percentile (whiskers), and minimum and maximum measurements (x).*, P = 0.00003; **, P < 0.00001 (t test). (E–G) Retroviral infection and expression of recombinant FAK rescued the defects in actin cytoskeleton and FA size and distribution. (E) Immunostaining of representative WT, _Fak-_KO, and FAK-rescued _Fak-_KO MKs with anti-FAK (green), phalloidin (red), and DAPI (blue). Insets show FAK staining, absent in KO but restored in FAK-rescued KO cells. (F and G) Quantitative analysis on VIN-stained KO, WT, and KO cells reexpressing FAK (RESC) show that the size of KO FAs and their relative VIN staining intensity was restored upon reexpression of FAK in KO keratinocytes. Error bars indicate SEM.
Figure 6.
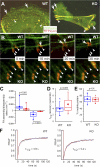
FAK promotes FA disassembly. Time-lapse images of primary MKs expressing K14-GFPactin (green) and RFPzyxin (red) to mark F-actin and FAs, respectively. (A) WT and KO cells generate broad lamellipodia and seed focal complexes (arrows). In KO MKs, lamellipodia formed preferentially at sites peripheral to the aberrant networks of stress fibers and enlarged FAs (arrowheads). This resulted in a more constricted cell shape. (B) Atypically thick actin bundles (green) converged at enlarged and less dynamic FAs in Fak KO MKs. Arrowheads mark FA position at 0 min. Note that FAs typically retract (arrows) after 30 min, but in KO MKs, FAs often remained at the same position for extended times. (C) Box-and-whisker diagram describing the differences in FA assembly and disassembly between WT and KO MKs. Box-and-whisker plots indicate the mean (squares), 25th percentile (bottom line), median (middle line), 75th percentile (top line), 5th and 95th percentile (whiskers), and minimum and maximum measurements (x). (D and E) Box-and-whisker diagrams describing the differences in half-time of FRAP and the mobile fraction of GFP-PXN between WT and KO MKs. n ≥ 5 adhesions on 10 individual cells. (F) Representative photobleaching and recovery kinetics of GFP-PXN in WT and KO MKs.
Figure 7.
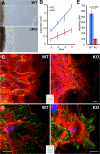
FAK controls cytoskeletal organization and directed migration from skin explants. (A) Phase-contrast images of WT and cKO skin explants (brown; left). The epidermal outgrowth from FAK-deficient explants (cKO) is severely decreased compared with WT explants. White dotted lines mark leading edges; yellow arrows denote distance between explant and its leading edge. (B) Quantification of epidermal outgrowth from skin explants. Mean of three independent experiments ± SD. (C and D) Immunostaining for actin (red) and either E-cadherin (green) or PXN (green) reveals that cells, actin fibers, and FAs are highly polarized and oriented toward the leading edge in WT but not cKO explants. Bars, 20 μm. (E) Fak KO MKs exhibit a markedly reduced ability to migrate from the top to the bottom compartment of a Boyden chamber containing fibroblast conditioned medium. Mean of three independent experiments ± SD. P = 0.0003, two-tailed t test.
Figure 8.
FAK regulates p190RhoGAP and Rho/ROCK signaling. (A–C) Immunoprecipitation and immunoblot analyses of tyrosine phosphorylation status of Src (pY418-Src) in MKs cultured in the presence or absence of serum/growth factors (A); tyrosine phosphorylation of p190RhoGAP in serum-starved Fak KO MKs (B); and phosphorylation of the regulatory subunit of MLC phosphatase (MYPT) and MLC (pMLC), reflective of increased Rho/ROCK mediated tension (C). (D and E) Enhanced pMLC in Fak KO versus WT MKs. Immunofluorescence microscopy of representative cells labeled with phosphorylated MLC antibodies (pMLC; pSer 19 MLC; green), MLC antibodies (MLC; red), and nuclear chromatin (DAPI; blue). Quantitative ratio imaging of pMLC and MLC indicates elevated pMLC levels in WT versus KO keratinocytes. (P = 1.59E-05, two-tailed t test; n ≥ 52 cells). Error bars indicate SEM.
Figure 9.
Interaction between FAK and tension-signaling components determines FA size and localization. (A and B) WT and KO MKs were plated on FN for 12 h before a 12-h treatment with the ROCK inhibitor Y27632 or the MLCK inhibitor ML7. Mean of three independent experiments ± SD. Immunofluorescence microscopy (A) and quantitative analyses (B) show that ROCK or MLCK inhibition relaxes the constricted actin cytoskeleton, suppresses robust FAs marked by VIN, and promotes cell spreading in KO MKs. Black asterisks indicate significant differences between WT and KO (P ≤ 0.05), and green asterisks indicate significant difference of treated cells from untreated cells (P ≤ 0.05). (C) Box-and-whisker plots showing the relative integrated fluorescence intensity of VIN-stained FAs in the presence of 5 μM Y27632, 5 μM nocodazole, 5 μM ML7, or 2 μM blebbistatin. Box-and-whisker plots indicate the mean (squares), 25th percentile (bottom line), median (middle line), 75th percentile (top line), 5th and 95th percentile (whiskers), and minimum and maximum measurements (x). n ≥ 10 for each condition. Green asterisks indicate significant differences (P ≤ 0.05) of treated cells from untreated cells, and black asterisks indicate significant differences (P ≤ 0.05) between treatments by analysis of variance and Tukey post hoc test.
Figure 10.
In the absence of FAK, PKL and PAK activity are diminished at FAs. (A) Immunoblot analyses reveal reduced levels of PKL without major differences in levels of PAK or PAK-interacting guanine nucleotide exchange factor (βPIX; actin is control). (B) Immunofluorescence microscopy shows that PKL, βPIX, PAK, and phosphorylated (active) PAK (p-PAK) localize at FAs in WT MKs, whereas Fak KO FAs still contain βPIX but show severely reduced staining for PKL, PAK, and p-PAK. Phalloidin (red) marks F-actin, and DAPI (blue) marks chromatin.
Similar articles
- Src and FAK kinases cooperate to phosphorylate paxillin kinase linker, stimulate its focal adhesion localization, and regulate cell spreading and protrusiveness.
Brown MC, Cary LA, Jamieson JS, Cooper JA, Turner CE. Brown MC, et al. Mol Biol Cell. 2005 Sep;16(9):4316-28. doi: 10.1091/mbc.e05-02-0131. Epub 2005 Jul 6. Mol Biol Cell. 2005. PMID: 16000375 Free PMC article. - A FAK-p120RasGAP-p190RhoGAP complex regulates polarity in migrating cells.
Tomar A, Lim ST, Lim Y, Schlaepfer DD. Tomar A, et al. J Cell Sci. 2009 Jun 1;122(Pt 11):1852-62. doi: 10.1242/jcs.046870. Epub 2009 May 12. J Cell Sci. 2009. PMID: 19435801 Free PMC article. - Dynamic conformational changes in the FERM domain of FAK are involved in focal-adhesion behavior during cell spreading and motility.
Papusheva E, Mello de Queiroz F, Dalous J, Han Y, Esposito A, Jares-Erijmanxa EA, Jovin TM, Bunt G. Papusheva E, et al. J Cell Sci. 2009 Mar 1;122(Pt 5):656-66. doi: 10.1242/jcs.028738. Epub 2009 Feb 10. J Cell Sci. 2009. PMID: 19208768 - Signal Transduction Mechanisms of Focal Adhesions: Src and FAK-Mediated Cell Response.
Katoh K. Katoh K. Front Biosci (Landmark Ed). 2024 Nov 20;29(11):392. doi: 10.31083/j.fbl2911392. Front Biosci (Landmark Ed). 2024. PMID: 39614431 Review. - Focal adhesion regulation of cell behavior.
Wozniak MA, Modzelewska K, Kwong L, Keely PJ. Wozniak MA, et al. Biochim Biophys Acta. 2004 Jul 5;1692(2-3):103-19. doi: 10.1016/j.bbamcr.2004.04.007. Biochim Biophys Acta. 2004. PMID: 15246682 Review.
Cited by
- The Effect of Adipocyte-Secreted Factors in Activating Focal Adhesion Kinase-Mediated Cell Signaling Pathway towards Metastasis in Breast Cancer Cells.
Mubtasim N, Gollahon L. Mubtasim N, et al. Int J Mol Sci. 2023 Nov 22;24(23):16605. doi: 10.3390/ijms242316605. Int J Mol Sci. 2023. PMID: 38068928 Free PMC article. - Activation of the low molecular weight protein tyrosine phosphatase in keratinocytes exposed to hyperosmotic stress.
Silva RA, Palladino MV, Cavalheiro RP, Machado D, Cruz BL, Paredes-Gamero EJ, Gomes-Marcondes MC, Zambuzzi WF, Vasques L, Nader HB, Souza AC, Justo GZ. Silva RA, et al. PLoS One. 2015 Mar 17;10(3):e0119020. doi: 10.1371/journal.pone.0119020. eCollection 2015. PLoS One. 2015. PMID: 25781955 Free PMC article. - Targeting and transport: how microtubules control focal adhesion dynamics.
Stehbens S, Wittmann T. Stehbens S, et al. J Cell Biol. 2012 Aug 20;198(4):481-9. doi: 10.1083/jcb.201206050. J Cell Biol. 2012. PMID: 22908306 Free PMC article. Review. - Regulation of brain tumor dispersal by NKCC1 through a novel role in focal adhesion regulation.
Garzon-Muvdi T, Schiapparelli P, ap Rhys C, Guerrero-Cazares H, Smith C, Kim DH, Kone L, Farber H, Lee DY, An SS, Levchenko A, Quiñones-Hinojosa A. Garzon-Muvdi T, et al. PLoS Biol. 2012;10(5):e1001320. doi: 10.1371/journal.pbio.1001320. Epub 2012 May 1. PLoS Biol. 2012. PMID: 22570591 Free PMC article. - Vimentin intermediate filaments control actin stress fiber assembly through GEF-H1 and RhoA.
Jiu Y, Peränen J, Schaible N, Cheng F, Eriksson JE, Krishnan R, Lappalainen P. Jiu Y, et al. J Cell Sci. 2017 Mar 1;130(5):892-902. doi: 10.1242/jcs.196881. Epub 2017 Jan 17. J Cell Sci. 2017. PMID: 28096473 Free PMC article.
References
- Arthur, W.T., L.A. Petch, and K. Burridge. 2000. Integrin engagement suppresses RhoA activity via a c-Src-dependent mechanism. Curr. Biol. 10:719–722. - PubMed
- Astier, A., H. Avraham, S.N. Manie, J. Groopman, T. Canty, S. Avraham, and A.S. Freedman. 1997. The related adhesion focal tyrosine kinase is tyrosine-phosphorylated after beta1-integrin stimulation in B cells and binds to p130cas. J. Biol. Chem. 272:228–232. - PubMed
- Avizienyte, E., A.W. Wyke, R.J. Jones, G.W. McLean, M.A. Westhoff, V.G. Brunton, and M.C. Frame. 2002. Src-induced de-regulation of E-cadherin in colon cancer cells requires integrin signalling. Nat. Cell Biol. 4:632–638. - PubMed
Publication types
MeSH terms
Substances
LinkOut - more resources
Full Text Sources
Other Literature Sources
Molecular Biology Databases
Miscellaneous

