Physicochemical and biological characterization of targeted, nucleic acid-containing nanoparticles - PubMed (original) (raw)
. 2007 Mar-Apr;18(2):456-68.
doi: 10.1021/bc0603539. Epub 2007 Feb 28.
Affiliations
- PMID: 17326672
- PMCID: PMC2517011
- DOI: 10.1021/bc0603539
Physicochemical and biological characterization of targeted, nucleic acid-containing nanoparticles
Derek W Bartlett et al. Bioconjug Chem. 2007 Mar-Apr.
Abstract
Nucleic acid-based therapeutics have the potential to provide potent and highly specific treatments for a variety of human ailments. However, systemic delivery continues to be a significant hurdle to success. Multifunctional nanoparticles are being investigated as systemic, nonviral delivery systems, and here, we describe the physicochemical and biological characterization of cyclodextrin-containing polycations (CDP) and their nanoparticles formed with nucleic acids including plasmid DNA (pDNA) and small interfering RNA (siRNA). These polycation/nucleic acid complexes can be tuned by formulation conditions to yield particles with sizes ranging from 60 to 150 nm, zeta potentials from 10 to 30 mV, and molecular weights from approximately 7 x 10⁷ to 1 x 10⁹ g mol-1 as determined by light scattering techniques. Inclusion complexes formed between adamantane (AD)-containing molecules and the beta-cyclodextrin molecules enable the modular attachment of poly(ethylene glycol) (AD-PEG) conjugates for steric stabilization and targeting ligands (AD-PEG-transferrin) for cell-specific targeting. A 70 nm particle can contain approximately 10 000 CDP polymer chains, approximately 2000 siRNA molecules, approximately 4000 AD-PEG5000 molecules, and approximately 100 AD-PEG5000-Tf molecules; this represents a significant payload of siRNA and a large ratio of siRNA to targeting ligand (20:1). The particles protect the nucleic acid payload from nuclease degradation, do not aggregate at physiological salt concentrations, and cause minimal erythrocyte aggregation and complement fixation at the concentrations typically used for in vivo application. Uptake of the nucleic acid-containing particles by HeLa cells is measured by flow cytometry and visualized by confocal microscopy. Competitive uptake experiments show that the transferrin-targeted particles display enhanced affinity for the transferrin receptor through avidity effects (multiligand binding). Functional efficacy of the delivered pDNA and siRNA is demonstrated through luciferase reporter protein expression and knockdown, respectively. The analysis of the CDP delivery vehicle provides insights that can be applied to the design of targeted nucleic acid delivery vehicles in general.
Figures
Figure 1
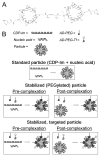
Formation of nucleic acid-containing particles using CDP-Im. (A) Schematic of the chemical structure of CDP-Im. (B) Schematic of particle assembly.
Figure 2
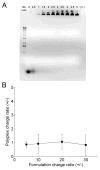
Effect of formulation charge ratio (+/−). (A) Electrophoretic gel mobility shift assay demonstrating the effect of formulation charge ratio on siRNA particle formation. (B) Individual particle charge ratio as a function of formulation charge ratio.
Figure 3
Nuclease stability of siRNA encapsulated within particles. For the t = 4 lanes, naked siRNA or siRNA within CDP-Im particles (3 (+/−)) was incubated in 50% mouse serum for 4 h at 37°C and 5% CO2. For the t = 0 lanes, serum was added to an equivalent amount of naked siRNA or siRNA within CDP-Im particles immediately before loading into the gel. Addition of 1% SDS was used to displace the siRNA from the particles to visualize the amount of intact siRNA remaining. The first lane demonstrates that the upper bands are nonspecific bands resulting from the interaction between SDS, serum, and the ethidium bromide stain, while the lower bands correspond to the free siRNA.
Figure 4
Transmission electron microscopy (left panels) and atomic force microscopy (center and right panels) images of (A) unPEGylated and (B) PEGylated siRNA particles formulated at a charge ratio of 3 (+/−). Scale bar = 100 nm (left panels) and 200 nm (center and right panels).
Figure 5
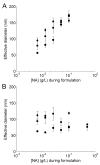
Effect of nucleic acid concentration ([NA]) during formulation on the size of (A) unPEGylated or (B) PEGylated particles. Particles were formulated at a charge ratio of 3 (+/−) using CDP-Im and either siRNA, pDNA, or CT-DNA (calf thymus DNA). PEGylated particles were formulated by adding a 1:1 mole ratio of AD-PEG5000:β-CD. Particle effective diameter was determined using dynamic light scattering. Squares = CDP-Im/siRNA particles, circles = CDP-Im/pDNA particles, diamonds = CDP-Im/CT-DNA particles.
Figure 6
Particle zeta potential as a function of AD-PEG5000-Tf ligand concentration during formulation. Particles were formulated at a charge ratio of 3 (+/−) using CDP-Im and siRNA, and the AD-PEG5000 or AD-PEG5000-Tf molecules were added after particle formation (post-complexation). The total number of moles of AD-PEG5000-X (AD-PEG5000 and AD-PEG5000-Tf) was equal to the number of moles of β-CD, and the mixture of AD-PEG5000 and AD-PEG5000-Tf is defined by the % AD-PEG5000-Tf.
Figure 7
Isothermal titration calorimetry (ITC) plots characterizing the binding between AD-PEG5000 molecules and free CDP-Im or siRNA particles. (A) CDP-Im/siRNA particle (3 (+/−)) and AD-PEG5000, (B) CDP-Im/siRNA particle (10 (+/−)) and AD-PEG5000, (C) CDP-Im and AD-PEG5000.
Figure 8
Relationship between particle size and molecular weight (MW) as determined by dynamic and multi-angle light scattering. Particles were formulated at a charge ratio of 3 (+/−) using CDP-Im and either siRNA, pDNA, or CT-DNA. Effective diameters were measured using dynamic light scattering, and molecular weights were determined using multi-angle light scattering. Squares = CDP-Im/siRNA particles, circles = CDP-Im/pDNA particles, diamonds = CDP-Im/CT-DNA particles, solid line = r3 scaling dependence of the MW of particles starting with a MW of 7×10⁷ g mol−1 for a 60-nm particle.
Figure 9
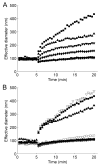
Aggregation of siRNA particles in physiological salt solutions. 140 μL of a 10X PBS solution were added to 1260 μL of the particles in water after 5 minutes, and dynamic light scattering was used to follow the formation of aggregates with time. (A) Effect of the ratio of AD-PEG5000:β-CD on particle stability. CDP-Im/siRNA (3 (+/−)) particles were formulated without AD-PEG5000 (black squares) or through the post-complexation method with an AD-PEG5000:β-CD mole ratio of 0.25:1 (black triangles), 0.5:1 (inverted black triangles), 0.75:1 (black diamonds), 1:1 (black circles), or 2:1 (black stars). (B) Effect of PEG chain length, adamantane conjugation, and Tf targeting ligand density on particle stability. CDP-Im/siRNA (3 (+/−)) particles were formulated without AD-PEG5000 (black squares), with a PEG5000 (no adamantane):β-CD mole ratio of 1:1 (open inverted triangles), with an AD-PEG500:β-CD mole ratio of 1:1 (black triangles), with an AD-PEG5000:β-CD mole ratio of 1:1 (black circles), or with a 1:1 mole ratio of AD-PEG5000-X:β-CD where AD-PEG5000-X was composed of 0.1 wt% AD-PEG5000-Tf (dark gray circles), 0.1 mol% AD-PEG5000-Tf (gray circles), 1 mol% AD-PEG5000-Tf (light gray circles), or 5 mol% AD-PEG5000-Tf (open circles) and the remainder AD-PEG5000.
Figure 10
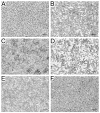
Erythrocyte aggregation. (A) 0.2 g L−1 CDP, (B) 2 g L−1 CDP, (C) 0.2 g L−1 CDP-Im, (D) 2 g L−1 CDP-Im, (E) CDP-Im/siRNA (3 (+/−)) particles at 0.2 g L−1 CDP-Im formulated with a 1:1 mole ratio of AD-PEG5000:β-CD, (F) PBS alone. Scale bar = 20 μm.
Figure 11
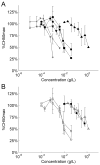
Complement fixation. (A) Complement fixation by free polycations. Asterisks = branched PEI, x = linear PEI, black triangles = pentalysine, inverted black triangles = polylysine (36-mer), black squares = CDP, black circles = CDP-Im. (B) Complement fixation by CDP/CT-DNA (3 (+/−)) particles formulated with a 1:1 mole ratio of AD-PEG5000:β-CD (black squares). The curves for CDP (open squares), CDP-Im (open circles), and pentalysine (open triangles) are shown again for comparison.
Figure 12
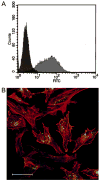
Uptake of CDP-Im particles containing fluorescein (FL)-labeled siRNA by HeLa cells. (A) Histogram of cell-associated fluorescence measured by flow cytometry. The left-most peaks correspond to the overlapping peaks for HeLa cells incubated with either Opti-MEM I alone or 100 nM naked FL-siRNA, while the right-most peak represents the cell-associated fluorescence after transfection with CDP-Im/FL-siRNA particles. (B) Confocal fluorescence microscopy image of HeLa cells after transfection with CDP-Im/FL-siRNA particles (green) and rhodamine phalloidin staining of F-actin (red). Scale bar = 50 μm.
Figure 13
Uptake of PEGylated and Tf-targeted particles in the presence of holo-Tf competitor. Particles were formulated at a charge ratio of 3 (+/−) using CDP-Im and siRNA. PEGylated particles (PEGpart) were formulated with a 1:1 mole ratio of AD-PEG5000:β-CD and Tf-targeted particles (Tfpart) were formulated with a 1:1 mole ratio of AD-PEG5000-X:β-CD where AD-PEG5000-X was composed of 99 mol% AD-PEG5000 and 1 mol% AD-PEG5000-Tf. Particles containing 100 nM siRNA were added to HeLa cells in 200 μL Opti-MEM I in the absence or presence of a 25X (moles holo-Tf: moles AD-PEG5000-Tf) excess of holo-Tf competitor.
Figure 14
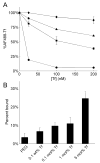
Effect of transferrin targeting ligand density on relative binding affinity. (A) Competitive TfR binding by free holo-Tf (circles), free AD-PEG5000-Tf (triangles), Tf-targeted CDP-Im/siRNA (3 (+/−), 1 mol% AD-PEG5000-Tf) particles (squares), and PEGylated CDP-Im/siRNA (3 (+/−)) particles (diamonds) in the presence of 20 nM AlexaFluor488-labeled holo-Tf. As a control, the PEGylated particles were formulated identically to the Tf-targeted particles at each concentration except without the addition of AD-PEG5000-Tf during formulation. (B) Live-cell binding assay. Particles were formulated at a charge ratio of 3 (+/−) using CDP-Im and Cy3-labeled siRNA. PEGylated particles (PEGpart) were formulated with a 1:1 mole ratio of AD-PEG5000:β-CD and Tf-targeted particles (Tfpart) were formulated with a 1:1 mole ratio of AD-PEG5000-X:β-CD where AD-PEG5000-X was composed of the stated % AD-PEG5000-Tf and the remainder AD-PEG5000. Particles containing 100 nM Cy3-siRNA were added to HeLa cells in 200 μL PBS and incubated on ice for 30 minutes. The “percent bound” represents the fraction of particles associated with the cell pellet after centrifugation.
Figure 15
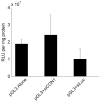
Luciferase expression 48 h after co-transfection of HeLa cells with particles containing pDNA and siRNA. Particles were formulated at a charge ratio of 3 (+/−) by combining CDP-Im with pGL3-CV (pGL3 Alone), pGL3-CV and a control siRNA (pGL3+siCON1), or pGL3-CV and an siRNA against luciferase (pGL3+siLuc).
Similar articles
- Transferrin-containing, cyclodextrin polymer-based particles for tumor-targeted gene delivery.
Bellocq NC, Pun SH, Jensen GS, Davis ME. Bellocq NC, et al. Bioconjug Chem. 2003 Nov-Dec;14(6):1122-32. doi: 10.1021/bc034125f. Bioconjug Chem. 2003. PMID: 14624625 - Targeted delivery of RNA-cleaving DNA enzyme (DNAzyme) to tumor tissue by transferrin-modified, cyclodextrin-based particles.
Pun SH, Tack F, Bellocq NC, Cheng J, Grubbs BH, Jensen GS, Davis ME, Brewster M, Janicot M, Janssens B, Floren W, Bakker A. Pun SH, et al. Cancer Biol Ther. 2004 Jul;3(7):641-50. doi: 10.4161/cbt.3.7.918. Epub 2004 Jul 9. Cancer Biol Ther. 2004. PMID: 15136766 - In vivo transfection using cyclodextrin-containing polycations.
Heidel JD. Heidel JD. Cold Spring Harb Protoc. 2011 Nov 1;2011(11):1392-3. doi: 10.1101/pdb.prot066654. Cold Spring Harb Protoc. 2011. PMID: 22046047 - Ligand-targeted particulate nanomedicines undergoing clinical evaluation: current status.
van der Meel R, Vehmeijer LJ, Kok RJ, Storm G, van Gaal EV. van der Meel R, et al. Adv Drug Deliv Rev. 2013 Oct;65(10):1284-98. doi: 10.1016/j.addr.2013.08.012. Epub 2013 Sep 6. Adv Drug Deliv Rev. 2013. PMID: 24018362 Review. - Lipid-based nanoparticles for nucleic acid delivery.
Li W, Szoka FC Jr. Li W, et al. Pharm Res. 2007 Mar;24(3):438-49. doi: 10.1007/s11095-006-9180-5. Pharm Res. 2007. PMID: 17252188 Review.
Cited by
- Targeted gene silencing using RGD-labeled chitosan nanoparticles.
Han HD, Mangala LS, Lee JW, Shahzad MM, Kim HS, Shen D, Nam EJ, Mora EM, Stone RL, Lu C, Lee SJ, Roh JW, Nick AM, Lopez-Berestein G, Sood AK. Han HD, et al. Clin Cancer Res. 2010 Aug 1;16(15):3910-22. doi: 10.1158/1078-0432.CCR-10-0005. Epub 2010 Jun 10. Clin Cancer Res. 2010. PMID: 20538762 Free PMC article. - Bioresponsive Nanomaterials: Recent Advances in Cancer Multimodal Imaging and Imaging-Guided Therapy.
Zeng Z, Gao H, Chen C, Xiao L, Zhang K. Zeng Z, et al. Front Chem. 2022 Mar 18;10:881812. doi: 10.3389/fchem.2022.881812. eCollection 2022. Front Chem. 2022. PMID: 35372260 Free PMC article. Review. - Nanocapsule-delivered Sleeping Beauty mediates therapeutic Factor VIII expression in liver sinusoidal endothelial cells of hemophilia A mice.
Kren BT, Unger GM, Sjeklocha L, Trossen AA, Korman V, Diethelm-Okita BM, Reding MT, Steer CJ. Kren BT, et al. J Clin Invest. 2009 Jul;119(7):2086-99. doi: 10.1172/JCI34332. Epub 2009 Jun 8. J Clin Invest. 2009. PMID: 19509468 Free PMC article. - Polysaccharide-Based Controlled Release Systems for Therapeutics Delivery and Tissue Engineering: From Bench to Bedside.
Miao T, Wang J, Zeng Y, Liu G, Chen X. Miao T, et al. Adv Sci (Weinh). 2018 Jan 8;5(4):1700513. doi: 10.1002/advs.201700513. eCollection 2018 Apr. Adv Sci (Weinh). 2018. PMID: 29721408 Free PMC article. Review. - Rhodamine-loaded poly(lactic-co-glycolic acid) nanoparticles for investigation of in vitro interactions with breast cancer cells.
Betancourt T, Shah K, Brannon-Peppas L. Betancourt T, et al. J Mater Sci Mater Med. 2009 Jan;20(1):387-95. doi: 10.1007/s10856-008-3594-z. Epub 2008 Sep 25. J Mater Sci Mater Med. 2009. PMID: 18815729
References
- Morrissey DV, Blanchard K, Shaw L, Jensen K, Lockridge JA, Dickinson B, McSwiggen JA, Vargeese C, Bowman K, Shaffer CS, Polisky BA, Zinnen S. Activity of stabilized short interfering RNA in a mouse model of hepatitis B virus replication. Hepatology. 2005;41:1349–1356. - PubMed
- Soutschek J, Akinc A, Bramiage B, Charisse K, Constien R, Donoghue M, Elbashir S, Geick A, Hadwiger P, Harborth J, John M, Kesavan V, Lavine G, Pandey RK, Racie T, Rajeev KG, Rohl I, Toudjarska I, Wang G, Wuschko S, Bumcrot D, Koteliansky V, Limmer S, Manoharan M, Vornlocher HP. Therapeutic silencing of an endogenous gene by systemic administration of modified siRNAs. Nature. 2004;432:173–178. - PubMed
- Dykxhoorn DM, Palliser D, Lieberman J. The silent treatment: siRNAs as small molecule drugs. Gene Ther. 2006;13:541–552. - PubMed
Publication types
MeSH terms
Substances
LinkOut - more resources
Full Text Sources
Other Literature Sources
Miscellaneous
