A rapid transient increase in hyaluronan synthase-2 mRNA initiates secretion of hyaluronan by corneal keratocytes in response to transforming growth factor beta - PubMed (original) (raw)
A rapid transient increase in hyaluronan synthase-2 mRNA initiates secretion of hyaluronan by corneal keratocytes in response to transforming growth factor beta
Naxin Guo et al. J Biol Chem. 2007.
Abstract
Keratocytes of the corneal stroma produce transparent extracellular matrix devoid of hyaluronan (HA); however, in corneal pathologies and wounds, HA is abundant. We previously showed primary keratocytes cultured under serum-free conditions to secrete matrix similar to that of normal stroma, but serum and transforming growth factor beta (TGFbeta) induced secretion of fibrotic matrix components, including HA. This study found HA secretion by primary bovine keratocytes to increase rapidly in response to TGFbeta, reaching a maximum in 12 h and then decreasing to <5% of the maximum by 48 h. Cell-free biosynthesis of HA by cell extracts also exhibited a transient peak at 12 h after TGFbeta treatment. mRNA for hyaluronan synthase enzymes HAS1 and HAS2 increased >10- and >50-fold, respectively, in 4-6 h, decreasing to near original levels after 24-48 h. Small interfering RNA against HAS2 inhibited the transient increase of HAS2 mRNA and completely blocked HA induction, but small interfering RNA to HAS1 had no effect on HA secretion. HAS2 mRNA was induced by a variety of mitogens, and TGFbeta acted synergistically to induce HAS2 by as much as 150-fold. In addition to HA synthesis, treatment with TGFbeta induced degradation of fluorescein-HA added to culture medium. These results show HA secretion by keratocytes to be initiated by a rapid transient increase in the HAS2 mRNA pool. The very rapid induction of HA expression in keratocytes suggests a functional role of this molecule in the fibrotic response of keratocytes to wound healing.
Figures
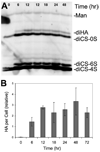
FIGURE 1. Stimulation of HA secretion by TGFβ and FBS
Primary keratocyte cultures were exposed to 2% FBS and 1 ng/ml TGFβ for different lengths of time, and proteoglycans were isolated from conditioned medium and digested with chondroitinase as described under “Experimental Procedures.” Disaccharides from HA and chondroitin/dermatan sulfate were analyzed by FACE. A, gel image illustrating the marked increase in HA during the first 12 h of exposure to FBS and TGFβ. B, quantitative analysis of the HA bands in this experiment carried out on triplicate samples normalized to the mannose internal standards (Man). The disaccharides used are as follows: diHA, hyaluronan disaccharide; diCS-0S, nonsulfated chondroitin sulfate disaccharide; diCS-6S, chondroitin sulfate disaccharide GlcNAC-6 sulfate; diCS-4S, chondroitin sulfate disaccharide GlcNAC-4 sulfate.
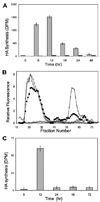
FIGURE 2. Rate of HA synthesis in response to TGFβ and FBS
A, primary keratocytes were stimulated with TGFβ and FBS for variable lengths of time as in Fig. 1. [3H]Glucosamine was added during the final 6 h of culture, and proteoglycans were recovered from the culture medium by ion exchange as described under “Experimental Procedures.” HA was captured by immobilized HABP before (gray bars) or after treatment with hyaluronidase (white bars) as described under “Experimental Procedures.” Data are expressed in terms of radioactivity (DPM) of HA per 106 cells. B, degradation of exogenous HA by keratocytes. High molecular weight fluorescein-labeled HA was added to keratocyte cultures at a concentration of 7.5 µg/ml for 24 h and then recovered from the culture medium by ion exchange chromatography. Samples of the starting material (triangles) were compared with HA incubated with keratocytes in serum-free medium (open circles) or with keratocytes after treatment with FBS and TGFβ for 48 h (filled circles), or hyaluronidase-digested HA (crosses) on Superose-6 size exclusion chromatography. Fluorescence values are normalized to those of the control. C, cell-free HA biosynthesis. Membrane preparations from keratocyte cultures treated for various lengths of time with FBS and TGFβ were used for cell-free biosynthesis of HA as described under “Experimental Procedures.” Bars show labeled HA synthesized in terms of disintegrations/min per µg of protein. Error bars show standard deviation of triplicate measurements.
FIGURE 3. Detecting mRNA for hyaluronan synthase genes in keratocytes
Total RNA was extracted from primary bovine keratocytes cultured in serum-free medium or treated for 6 h with FBS and TGFβ as in Fig. 1. RNA was reverse-transcribed using random primers, and DNA was amplified for 35 cycles using primers representing unique regions from bovine HAS1, 128 bp; HAS2, 134 bp; and HAS3, 234 bp (Table 1). The products were separated on 6% acrylamide gels and stained using SYBR Gold. Lane 7 shows DNA molecular size standards.
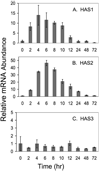
FIGURE 4. Temporal response of HAS mRNA to TGFβ
Primary bovine keratocytes were exposed to FBS and TGFβ as in Fig. 1, for the intervals shown, and the total RNA was analyzed by qRT-PCR for each gene product compared with 18 S RNA in the same sample as described under “Experimental Procedures.” Bars show the standard error of triplicate analyses carried on duplicate cultures. For each gene, mRNA abundance at time 0 was set to 1.
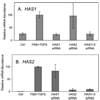
FIGURE 5. Inhibition of HAS up-regulation by siRNA
Primary uncultured keratocytes were transfected with siRNA for HAS1, HAS2, or a combination, and cultured for 20 h in serum-free conditions. HAS gene expression was induced with TGFβ and FBS for 6 h as in Fig. 1, and total cellular RNA was assayed for mRNA abundance of HAS1 (A) and HAS2 (B). mRNA levels are normalized so that the induced samples = 100. Error bars show triplicate analyses of RNA from three pooled cultures. Ctrl, control.
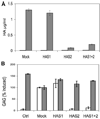
FIGURE 6. Knockdown of HA biosynthesis by HAS2 siRNA
Primary bovine keratocytes were transfected with siRNA against HAS1, HAS2, or a combination as described under “Experimental Procedures.” The cells were cultured in serum-free medium for 48 hand then exposed to FBS and TGFβ for 48 h. A, HA in serum-free medium (left, open bars) or TGFβ-FBS (right, gray bars) was analyzed by HABP-ELISA as described “Experimental Procedures.” B, chondroitin/dermatan sulfate (CS) (gray bars) and HA (open bars) were analyzed by FACE gels similar to those in Fig. 1. Ctrl (control) shows HA and CS expression in serum-free medium for 48 h. All other samples show expression during 48 h after induction with TGFβ-FBS. Mock indicates no siRNA. HA and chondroitin/dermatan sulfate values are normalized to the Mock samples. Bars show standard deviation of triplicate analyses.
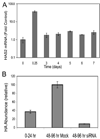
FIGURE 7. Long term HA biosynthesis is _HAS2_-related
A, primary bovine keratocytes were exposed to FBS and TGFβ similarly to Fig. 1 for the intervals shown, and the HAS2 mRNA was determined by qRT-PCR as described in Fig. 4. Bars show the standard error of triplicate analyses of duplicate cultures. RNA abundance is compared with untreated cells = 1. Note the log scale in the y axis. B, HA biosynthesis was induced in keratocytes for 24 h followed by transfection with siRNA against HAS2. Conditioned medium was collected for the period 24–72 h after siRNA transfection (48–96 h after TGFβ treatment). HA was determined in the collected media using FACE. Mock cells were subject to electroporation without siRNA.
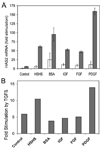
FIGURE 8. Synergistic stimulation of HAS2 levels by TGFβ and mitogens
A, primary bovine keratocytes were exposed to various agents as in Table 1 in the presence (dark bars) or absence (open bars) of 1 ng/ml TGFβ. HAS2 mRNA was determined by qRT-PCR after 6 h of exposure. Error bars show standard deviation of triplicate analyses. mRNA levels in untreated cells were set = 1. B, shows the ratio of mRNA abundance for samples in A (TGFβ treated/no TGFβ). HSHS, 2% heparin-stripped horse serum; BSA, 1 mg/ml Albumax, lipid-rich bovine serum albumin; IGF, 50 ng/ml insulin-like growth factor 1; FGF, 10 ng/ml fibroblast growth factor-2; PDGF, 10 ng/ml platelet-derived growth factor BB.
Similar articles
- Peroxisome proliferator-activated receptor gamma ligands inhibit transforming growth factor-beta-induced, hyaluronan-dependent, T cell adhesion to orbital fibroblasts.
Guo N, Woeller CF, Feldon SE, Phipps RP. Guo N, et al. J Biol Chem. 2011 May 27;286(21):18856-67. doi: 10.1074/jbc.M110.179317. Epub 2011 Mar 25. J Biol Chem. 2011. PMID: 21454487 Free PMC article. - Hyaluronan synthesis mediates the fibrotic response of keratocytes to transforming growth factor beta.
Guo N, Li X, Mann MM, Funderburgh ML, Du Y, Funderburgh JL. Guo N, et al. J Biol Chem. 2010 Oct 15;285(42):32012-9. doi: 10.1074/jbc.M110.127183. Epub 2010 Aug 4. J Biol Chem. 2010. PMID: 20685654 Free PMC article. - Expression regulation of hyaluronan synthase in corneal endothelial cells.
Usui T, Amano S, Oshika T, Suzuki K, Miyata K, Araie M, Heldin P, Yamashita H. Usui T, et al. Invest Ophthalmol Vis Sci. 2000 Oct;41(11):3261-7. Invest Ophthalmol Vis Sci. 2000. PMID: 11006212 - Cell Energy Metabolism and Hyaluronan Synthesis.
Caon I, Parnigoni A, Viola M, Karousou E, Passi A, Vigetti D. Caon I, et al. J Histochem Cytochem. 2021 Jan;69(1):35-47. doi: 10.1369/0022155420929772. Epub 2020 Jul 6. J Histochem Cytochem. 2021. PMID: 32623953 Free PMC article. Review. - Role of transforming growth factor Beta in corneal function, biology and pathology.
Tandon A, Tovey JC, Sharma A, Gupta R, Mohan RR. Tandon A, et al. Curr Mol Med. 2010 Aug;10(6):565-78. doi: 10.2174/1566524011009060565. Curr Mol Med. 2010. PMID: 20642439 Free PMC article. Review.
Cited by
- Effect of MT3 on Retinal and Choroidal TGF-_β_2 and HAS2 Expressions in Form Deprivation Myopia of Guinea Pig.
Li T, Zhou X, Li B, Jiang B. Li T, et al. J Ophthalmol. 2017;2017:5028019. doi: 10.1155/2017/5028019. Epub 2017 Oct 15. J Ophthalmol. 2017. PMID: 29163988 Free PMC article. - Peroxisome proliferator-activated receptor gamma ligands inhibit transforming growth factor-beta-induced, hyaluronan-dependent, T cell adhesion to orbital fibroblasts.
Guo N, Woeller CF, Feldon SE, Phipps RP. Guo N, et al. J Biol Chem. 2011 May 27;286(21):18856-67. doi: 10.1074/jbc.M110.179317. Epub 2011 Mar 25. J Biol Chem. 2011. PMID: 21454487 Free PMC article. - Hyaluronan synthesis mediates the fibrotic response of keratocytes to transforming growth factor beta.
Guo N, Li X, Mann MM, Funderburgh ML, Du Y, Funderburgh JL. Guo N, et al. J Biol Chem. 2010 Oct 15;285(42):32012-9. doi: 10.1074/jbc.M110.127183. Epub 2010 Aug 4. J Biol Chem. 2010. PMID: 20685654 Free PMC article. - Cloning and characterization of cell strains derived from human corneal stroma and sclera.
Kashiwagi Y, Nishitsuka K, Namba H, Kamiryo M, Takamura H, Yamashita H. Kashiwagi Y, et al. Jpn J Ophthalmol. 2010 Jan;54(1):74-80. doi: 10.1007/s10384-009-0749-5. Epub 2010 Feb 12. Jpn J Ophthalmol. 2010. PMID: 20151280 - Effects of 4-methylumbelliferone and high molecular weight hyaluronic acid on the inflammation of corneal stromal cells induced by LPS.
Li F, Hao P, Liu G, Wang W, Han R, Jiang Z, Li X. Li F, et al. Graefes Arch Clin Exp Ophthalmol. 2017 Mar;255(3):559-566. doi: 10.1007/s00417-016-3561-1. Epub 2016 Dec 6. Graefes Arch Clin Exp Ophthalmol. 2017. PMID: 27924359
References
- Spicer AP, Tien JY. Birth Defects Res. C Embryo Today. 2004;72:89–108. - PubMed
- Fitzsimmons TD, Molander N, Stenevi U, Fagerholm P, Schenholm M, von Malmborg A. Investig. Ophthalmol. Vis. Sci. 1994;35:2774–2782. - PubMed
- Hassell JR, Cintron C, Kublin C, Newsome DA. Arch. Biochem. Biophys. 1983;222:362–369. - PubMed
- Hirsch M, Prenant G, Renard G. Exp. Eye Res. 2001;72:123–135. - PubMed
- Meek KM, Leonard DW, Connon CJ, Dennis S, Khan S. Eye (Lond.) 2003;17:927–936. - PubMed
Publication types
MeSH terms
Substances
LinkOut - more resources
Full Text Sources
Other Literature Sources
