Resting state cortical connectivity reflected in EEG coherence in individuals with autism - PubMed (original) (raw)
Resting state cortical connectivity reflected in EEG coherence in individuals with autism
Michael Murias et al. Biol Psychiatry. 2007.
Abstract
Background: Theoretical conceptions of autism spectrum disorder (ASD) and experimental studies of cerebral blood flow suggest abnormalities in connections among distributed neural systems in ASD.
Methods: Functional connectivity was assessed with electroencephalographic coherence between pairs of electrodes in a high-density electrode array in narrow frequency bands among 18 adults with ASD and 18 control adults in an eyes closed resting state.
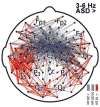
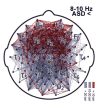
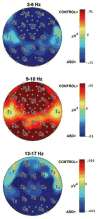
Results: In the theta (3-6 Hz) frequency range, locally elevated coherence was evident for the ASD group, especially within left hemisphere frontal and temporal regions. In the lower alpha range (8-10 Hz), globally reduced coherence was evident for the ASD group within frontal regions and between frontal and all other scalp regions. The ASD group exhibited significantly greater relative power between 3 and 6 Hz and 13-17 Hz and significantly less relative power between 9 and 10 Hz.
Conclusions: Robust patterns of over- and under-connectivity are apparent at distinct spatial and temporal scales in ASD subjects in the eyes closed resting state.
Figures
Figure 1
Eyes closed resting coherence spectra, averaged across all the 5,778 electrode pairs separated by at least 3 cm. along the scalp surface. Shaded areas indicate frequencies at which more than 5% of electrode pairs differentiated control and ASD groups at p < .025. Between 3–6 Hz, ASD coherences are significantly greater than controls. In the lower alpha range (8–10 Hz), ASD coherences are significantly reduced. Mean coherence across these channel pairs is inflated due to the inclusion of pairs separated by less than 10 cm.
Figure 2
Topography of significantly elevated ASD group coherences in the 3–6 Hz band. Lines are drawn between channel pairs at which ASD group coherence exceeded control with _p_-values below .025. Lines are colored according to distance (cm) between electrode pairs, along the scalp surface.
Figure 3
Topography of significantly elevated control group coherences in the 8–10 Hz band. Lines are drawn between channel pairs at which control group coherence exceeded ASD with _p_-values below .025. Lines are colored according to distance (cm) between electrode pairs, along the scalp surface.
Figure 4
Topography of relative power differences (control minus ASD). Green dots indicate significant difference between groups at p < .025. ASD relative power exceeded control at 3–6 Hz (top) and 13–17 Hz (bottom). Control potential relative power exceeded ASD at 9–10 Hz (middle).
Similar articles
- A big-world network in ASD: dynamical connectivity analysis reflects a deficit in long-range connections and an excess of short-range connections.
Barttfeld P, Wicker B, Cukier S, Navarta S, Lew S, Sigman M. Barttfeld P, et al. Neuropsychologia. 2011 Jan;49(2):254-63. doi: 10.1016/j.neuropsychologia.2010.11.024. Epub 2010 Nov 24. Neuropsychologia. 2011. PMID: 21110988 - Patterns of altered neural synchrony in the default mode network in autism spectrum disorder revealed with magnetoencephalography (MEG): Relationship to clinical symptomatology.
Lajiness-O'Neill R, Brennan JR, Moran JE, Richard AE, Flores AM, Swick C, Goodcase R, Andersen T, McFarlane K, Rusiniak K, Kovelman I, Wagley N, Ugolini M, Albright J, Bowyer SM. Lajiness-O'Neill R, et al. Autism Res. 2018 Mar;11(3):434-449. doi: 10.1002/aur.1908. Epub 2017 Dec 18. Autism Res. 2018. PMID: 29251830 - Enhanced connectivity between visual cortex and other regions of the brain in autism: a REM sleep EEG coherence study.
Léveillé C, Barbeau EB, Bolduc C, Limoges E, Berthiaume C, Chevrier E, Mottron L, Godbout R. Léveillé C, et al. Autism Res. 2010 Oct;3(5):280-5. doi: 10.1002/aur.155. Autism Res. 2010. PMID: 20717953 - Developmental changes of functional and directed resting-state connectivities associated with neuronal oscillations in EEG.
Michels L, Muthuraman M, Lüchinger R, Martin E, Anwar AR, Raethjen J, Brandeis D, Siniatchkin M. Michels L, et al. Neuroimage. 2013 Nov 1;81:231-242. doi: 10.1016/j.neuroimage.2013.04.030. Epub 2013 May 1. Neuroimage. 2013. PMID: 23644004 - Brain neural synchronization and functional coupling in Alzheimer's disease as revealed by resting state EEG rhythms.
Babiloni C, Lizio R, Marzano N, Capotosto P, Soricelli A, Triggiani AI, Cordone S, Gesualdo L, Del Percio C. Babiloni C, et al. Int J Psychophysiol. 2016 May;103:88-102. doi: 10.1016/j.ijpsycho.2015.02.008. Epub 2015 Feb 7. Int J Psychophysiol. 2016. PMID: 25660305 Review.
Cited by
- Relation between Resting State Front-Parietal EEG Coherence and Executive Function in Parkinson's Disease.
Teramoto H, Morita A, Ninomiya S, Akimoto T, Shiota H, Kamei S. Teramoto H, et al. Biomed Res Int. 2016;2016:2845754. doi: 10.1155/2016/2845754. Epub 2016 Jun 28. Biomed Res Int. 2016. PMID: 27433473 Free PMC article. - Gender-specific modulation of neural mechanisms underlying social reward processing by Autism Quotient.
Barman A, Richter S, Soch J, Deibele A, Richter A, Assmann A, Wüstenberg T, Walter H, Seidenbecher CI, Schott BH. Barman A, et al. Soc Cogn Affect Neurosci. 2015 Nov;10(11):1537-47. doi: 10.1093/scan/nsv044. Epub 2015 May 4. Soc Cogn Affect Neurosci. 2015. PMID: 25944965 Free PMC article. - Social EEG: A novel neurodevelopmental approach to studying brain-behavior links and brain-to-brain synchrony during naturalistic toddler-parent interactions.
Norton ES, Manning BL, Harriott EM, Nikolaeva JI, Nyabingi OS, Fredian KM, Page JM, McWeeny S, Krogh-Jespersen S, MacNeill LA, Roberts MY, Wakschlag LS. Norton ES, et al. Dev Psychobiol. 2022 Mar;64(3):e22240. doi: 10.1002/dev.22240. Dev Psychobiol. 2022. PMID: 35312062 Free PMC article. - Alpha Waves as a Neuromarker of Autism Spectrum Disorder: The Challenge of Reproducibility and Heterogeneity.
Lefebvre A, Delorme R, Delanoë C, Amsellem F, Beggiato A, Germanaud D, Bourgeron T, Toro R, Dumas G. Lefebvre A, et al. Front Neurosci. 2018 Oct 1;12:662. doi: 10.3389/fnins.2018.00662. eCollection 2018. Front Neurosci. 2018. PMID: 30327586 Free PMC article. - Inter-regional brain communication and its disturbance in autism.
Schipul SE, Keller TA, Just MA. Schipul SE, et al. Front Syst Neurosci. 2011 Feb 22;5:10. doi: 10.3389/fnsys.2011.00010. eCollection 2011. Front Syst Neurosci. 2011. PMID: 21390284 Free PMC article.
References
- Americal Psychiatric Association. Diagnostic and statistical manual of mental disorders. 4. Washington, DC: 1994.
- Bendat JS, Piersol AG. Random data: Analysis and measurement procedures. 3. New York: John Wiley & Sons; 2001.
- Bertrand O, Perrin F, Pernier J. A theoretical justification of the average reference in topographic evoked potential studies. Electroencephalogr Clin Neurophysiol. 1985;62(6):462–464. - PubMed
- Casanova MF, van Kooten IAJ, Switala AE, van Engeland H, Heinsen H, Steinbusch HWM, et al. Minicolumnar abnormalities in autism. Acta Neuropathologica. 2006;V112(3):287. - PubMed
Publication types
MeSH terms
Grants and funding
- U19 HD035465/HD/NICHD NIH HHS/United States
- U54 MH066399/MH/NIMH NIH HHS/United States
- AS2154/AS/Autism Speaks/United States
- U19HD34565/HD/NICHD NIH HHS/United States
- U54MH066399/MH/NIMH NIH HHS/United States
LinkOut - more resources
Full Text Sources
Other Literature Sources


