Molecular insights into the klotho-dependent, endocrine mode of action of fibroblast growth factor 19 subfamily members - PubMed (original) (raw)
. 2007 May;27(9):3417-28.
doi: 10.1128/MCB.02249-06. Epub 2007 Mar 5.
Andrew Beenken, Omar A Ibrahimi, Juliya Kalinina, Shaun K Olsen, Anna V Eliseenkova, ChongFeng Xu, Thomas A Neubert, Fuming Zhang, Robert J Linhardt, Xijie Yu, Kenneth E White, Takeshi Inagaki, Steven A Kliewer, Masaya Yamamoto, Hiroshi Kurosu, Yasushi Ogawa, Makoto Kuro-o, Beate Lanske, Mohammed S Razzaque, Moosa Mohammadi
Affiliations
- PMID: 17339340
- PMCID: PMC1899957
- DOI: 10.1128/MCB.02249-06
Molecular insights into the klotho-dependent, endocrine mode of action of fibroblast growth factor 19 subfamily members
Regina Goetz et al. Mol Cell Biol. 2007 May.
Abstract
Unique among fibroblast growth factors (FGFs), FGF19, -21, and -23 act in an endocrine fashion to regulate energy, bile acid, glucose, lipid, phosphate, and vitamin D homeostasis. These FGFs require the presence of Klotho/betaKlotho in their target tissues. Here, we present the crystal structures of FGF19 alone and FGF23 in complex with sucrose octasulfate, a disaccharide chemically related to heparin. The conformation of the heparin-binding region between beta strands 10 and 12 in FGF19 and FGF23 diverges completely from the common conformation adopted by paracrine-acting FGFs. A cleft between this region and the beta1-beta2 loop, the other heparin-binding region, precludes direct interaction between heparin/heparan sulfate and backbone atoms of FGF19/23. This reduces the heparin-binding affinity of these ligands and confers endocrine function. Klotho/betaKlotho have evolved as a compensatory mechanism for the poor ability of heparin/heparan sulfate to promote binding of FGF19, -21, and -23 to their cognate receptors.
Figures
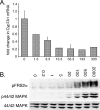
FIG. 1.
Recombinant FGF19 protein is biologically active. (A) Repression of Cyp7a1 by FGF19. FGF19 (1.3 to 333.3 μg kg body weight−1) was injected intravenously into mice, and CYP7A1 mRNA levels were measured by real-time RT-PCR using total RNA isolated from liver tissue. The data are presented as the change in CYP7A1 mRNA level. (B) Activation of FRS2α and MAP kinase cascade by FGF19. H4IIE hepatoma cells were stimulated with FGF19 (0.2 ng ml−1 to 2 μg ml−1; numbers above the lanes show amounts in ng ml−1) for 10 min, and cell lysate was prepared and analyzed for phosphorylation of FRS2α (pFRS2α) and 44/42 MAP kinase (p44/42 MAPK) by immunoblotting. Total protein expression of 44/42 MAP kinase was measured to confirm even expression among the cell samples.
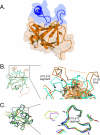
FIG. 2.
The HBS topology of FGF19 is completely different from that of classical, paracrine-acting FGFs. (A) Molecular surface and ribbon representation of the FGF19 crystal structure. The molecular surface is shown as transparent. The β strands of FGF19 are labeled according to the conventional strand nomenclature for FGF1 and FGF2. Note that FGF19 lacks the β11 strand present in classical, paracrine-acting FGFs. The HBS, consisting of the loop between β1 and β2 and the segment between β10 and β12, is in blue. A secondary structure element unique to the HBS of FGF19 is the α11 helix located in the β10-β12 segment. Note that α11 and the β1-β2 loop protrude from the β-trefoil like core domain of FGF19 (orange) and that there is a cleft between these two heparin-binding regions. Cysteines 58 (in β2) and 70 (in β3) form a disulfide bridge which stabilizes the altered conformation of the heparin-binding region between β10 and β12 (explained in more detail below). Sulfur atoms are in green. NT and CT, N and C termini of FGF19. (B) Superimposition of the Cα trace of the FGF19 β-trefoil like core onto the Cα trace of the FGF2 β-trefoil from the FGF2-FGFR1c-heparin structure (PDB ID, 1FQ9). A close-up view of the heparin-binding regions is shown on the right, and to aid the reader, a view of the whole structure is shown on the left. FGF19 and FGF2 are in orange and cyan blue, respectively. Black arrowheads mark leucines 145 and 162, at which the Cα trace of FGF19 diverges from that of FGF2 and converges again, respectively. Note that cysteines 58 and 70 of FGF19 form a disulfide bridge which packs against these two leucine residues, thereby stabilizing the altered conformation of the β10-β12 segment. Also note that there are no intramolecular interactions between the β1-β2 loop and the β10-β12 segment in FGF19 (indicated by a dashed orange line with arrowheads; see also the cleft illustrated in panel A), whereas in FGF2, these regions interact with one another (indicated by a cyan blue line with arrowheads). Black circles denote glycine and threonine residues of the GXXXXGXX(T/S) motif present in FGF2 and other classical FGFs (see also panel C). (C) Superimposition of the Cα traces of the β-trefoil core domain of classical, paracrine-acting FGFs onto one another. The view is from the top looking down into the β-trefoil core. A close-up view of the heparin-binding region encompassing β10 and β12 is shown on the right, and to orient the reader, a view of the whole structure is shown on the left. The FGF ligands are colored as follows: FGF1 (PDB ID, 1EVT), green; FGF2 (PDB ID, 1FQ9), cyan blue; FGF4 (PDB ID, 1IJT), red; FGF7 (PDB ID, 1QQL), blue; FGF9 (PDB ID, 1IHK), yellow; FGF10 (PDB ID, 1NUN), purple; and FGF8b (PDB ID, 2FDB), brown. Note that the Cα traces of these seven classical FGFs take nearly identical paths in the β10-β12 region. In panel B, FGF2 was chosen from this set of FGFs to illustrate the divergence of FGF19 at this region. Glycine and threonine/serine residues of the GXXXXGXX(T/S) motif conserved in these classical FGFs are marked by black arrows.
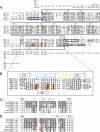
FIG. 3.
Structure-based sequence analysis of FGF19 and FGF23. (A) Structure-based sequence alignment of the FGF19 subfamily members and selected paracrine-acting FGFs. Predicted signal sequences have been omitted. Residue numbers are in parentheses on the left of the alignment. Secondary structure elements are given on top of the sequence alignment. The locations and lengths of the secondary structure elements are indicated by boxes in the sequences. A dash in the sequence represents a gap introduced to optimize the alignment. A black box drawn around the sequences marks the boundaries of the β-trefoil core domain for each FGF. Glycine and threonine residues of the GXXXXGXX(T/S) motif are in orange. Note that these residues are conserved among classical, paracrine-acting FGFs but absent in the sequences of the FGF19 subfamily. Residues which, based on published FGF-FGFR structures, likely account for low receptor-binding affinity of FGF19, -21, and -23 are in cyan blue. Cysteine residues forming disulfide bridges are in green. The proteolytic cleavage site motif RXXR in FGF23 is in purple. (B) Close-up view of the sequence alignment of the heparin-binding region encompassing β10 and β12. Sequence labeling is the same as in panel A. (C) Sequence alignment of the heparin-binding β10-β12 region of FGF19 orthologs. Sequence identity to human FGF19 within the β10-β12 region is highlighted in gray. Note the low degree of sequence identity between human FGF19 and rodent and fish orthologs. (D) Sequence alignment of the heparin-binding β10-β12 region of FGF23 orthologs. Sequence labeling is the same as in panel C. Residues critical for the conformation of this region, such as lysine 142 and phenylalanine 145, are indicated by red boxes.
FIG. 4.
Recombinant FGF23 protein is biologically active. (A) The unique C-terminal tail of FGF23 is required for phosphaturic activity of FGF23. FGF23wt, FGF23ADHR, and FGF23core were injected intraperitoneally into _Fgf23_-null mice. Serum phosphate levels were determined before and after protein injection. Note that _Fgf23_-null mice show hyperphosphatemia compared to wild-type mice. (B) The C-terminal tail of FGF23 is required for activation of EGR1 gene expression by FGF23. HEK293 cells transiently transfected with Klotho were stimulated with FGF23wt, FGF23ADHR, and FGF23core, 1 ng ml−1 each, for 30 min. Total RNA was extracted from the cells, and EGR1 mRNA levels were measured by real-time RT-PCR. Data are plotted as change in EGR1 mRNA expression. (C) The C-terminal tail of FGF23 is required for activation of FRS2α and MAP kinase cascade by FGF23. HEK293 cells stably expressing Klotho were stimulated with FGF23wt, FGF23ADHR, and FGF23core, 3 nM to 3 μM each, for 10 min. Cell lysate was prepared and analyzed for phosphorylation of FRS2α (pFRS2α) and 44/42 MAP kinase (p44/42 MAPK) by immunoblotting. Total protein levels of 44/42 MAP kinase and Klotho were measured to control for equal sample loading. (D) The C-terminal tail of FGF23 is required for binding to Klotho. Lysate of HEK293 cells stably expressing Klotho was incubated with FGF23ADHR, FGF23core, FGF21, or protein sample buffer (control). Klotho was immunoprecipitated from cell lysate (IP) and analyzed for bound FGF proteins.
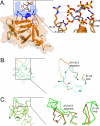
FIG. 5.
The HBS topology of FGF23 differs from that of classical, paracrine-acting FGFs and from that of FGF19. (A) Molecular surface and ribbon representation of the crystal structure of the FGF23 core domain in complex with a SOS molecule, shown as sticks. The molecular surface is shown as transparent. A view of the whole structure is shown on the left; a detailed view of the SOS interactions with FGF23 is shown on the right. The β strands of FGF23 are labeled according to the conventional strand nomenclature for FGF1 and FGF2. Note that, like FGF19, FGF23 lacks the β11 strand present in classical, paracrine-acting FGFs. The HBS, consisting of the loop between β1 and β2 and the segment between β10 and β12, is in blue. Note that these regions do not protrude from the β-trefoil like core like those in FGF19 and that the cleft separating these regions from one another is not as prominent as the cleft seen in the FGF19 structure (compare Fig. 2A). A secondary structure element unique to the HBS of FGF23 is the g11 helix, located in the segment between β10 and β12. Also note the C-terminal g13 helix, which is tethered to the core. NT and CT, N and C termini of the FGF23 core domain. The SOS molecule makes hydrogen bonds with arginine 48 and asparagine 49 of the β1-β2 loop and with arginines 140 and 143 of the β10-β12 segment. Note that the sulfated fructose ring of SOS also interacts with backbone atoms of these regions. (B) Superimposition of the Cα trace of the FGF23 β-trefoil like core onto the Cα trace of the FGF2 β-trefoil from the FGF2-FGFR1c-heparin structure (PDB ID, 1FQ9). The viewpoint is from top of the β-trefoil like core. A close-up view of the heparin-binding regions is shown on the right, and to assist the reader, a view of the whole structure is shown on the left. FGF23 and FGF2 are in orange and cyan blue, respectively. Black arrows mark leucine 138 and proline 153, at which the Cα trace of FGF23 diverges from that of FGF2 and converges again, respectively. Glycine and threonine residues of the GXXXXGXX(T/S) motif present in FGF2 and other classical FGFs are labeled with black circles (see also Fig. 2C). The cyan blue arrowhead marks a one-residue insertion in the β9-β10 loop of FGF2 which is sterically incompatible with the conformation of the β10-β12 segment in FGF23. (C) Superimposition of the Cα trace of the FGF23 core domain onto the Cα trace of the FGF19 core. A close-up view of the heparin-binding regions is shown on the right, and to aid the reader, a view of the whole structure is shown on the left. FGF23 and FGF19 are in orange and green, respectively. Black arrows mark glycine 139 and serine 155, at which the Cα trace of FGF23 diverges from that of FGF19 and converges again, respectively. Also note the different β1-β2 loop conformations of FGF23 and FGF19 concurrent with differences in the length of the β1-β2 loop (see Fig. 3A). As in FGF19, there are no intramolecular interactions between the β1-β2 loop and the β10-β12 segment (see also the clefts illustrated in panel A and in Fig. 2A).
FIG. 6.
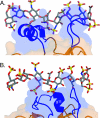
The HBS topologies of FGF19 and FGF23 impact the mode of heparin binding. (A) Detailed view of heparin binding to FGF19 in a 2:2:2 FGF19-FGFR1c-heparin model created by superimposing FGF19 onto FGF2 in the FGF2-FGFR1c-heparin dimer (PDB ID, 1FQ9). The heparin-binding regions of FGF19 are shown in ribbon and transparent surface representation; the heparin molecule is shown in stick representation. Carbon atoms are in gray, nitrogen atoms are blue, oxygen atoms are red, and sulfur atoms are yellow. Note that there are major steric clashes between the heparin-binding regions of FGF19 and sugar backbone and sulfate groups of the heparin oligosaccharide. A translation of the heparin molecule away from the HBS would be necessary to avoid these clashes, and as a result, the heparin molecule would not be able to interact with backbone atoms of the cleft. (B) Detailed view of heparin binding to FGF23 in a 2:2:2 FGF23-FGFR1c-heparin model created by superimposing the FGF23 core domain onto FGF2 in the FGF2-FGFR1c-heparin dimer (PDB ID, 1FQ9). Representation of the heparin-binding regions of FGF23 and the heparin oligosaccharide, and atom coloring are the same as in panel A. Note that the heparin-binding regions of FGF23 also sterically clash with sugar backbone and sulfate groups of the heparin molecule, although not to the extent as seen in the FGF19-heparin model (compare panels A and B).
FIG. 7.
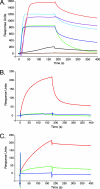
FGF19 subfamily members exhibit unusually low binding affinity for heparin, and structure-based mutagenesis identifies residues engaged in heparin binding in FGF19 and FGF23. (A) Representative SPR sensorgram of heparin binding of FGF19 (orange), FGF21 (brown), FGF23 (black), FGF10 (purple), FGF7 (blue), FGF4 (red), FGF2 (cyan blue) and FGF1 (green), 100 nM each. (B) Representative SPR sensorgram of heparin-binding of wild-type FGF19 (red) and FGF19 HBS mutants, FGF19K149A (blue) and FGF19K149A,R157A (green), 800 nM each. (C) SPR sensorgram illustrating heparin-binding of HBS mutants of FGF23, FGF23R48,N49 (green), and FGF23R140,R143 (blue), 800 nM each. The mutations were introduced into the ADHR mutant of FGF23 (red). FGF-heparin binding was studied at 25°C. The biosensor chip response is plotted as a function of time.
Similar articles
- The structural biology of the FGF19 subfamily.
Beenken A, Mohammadi M. Beenken A, et al. Adv Exp Med Biol. 2012;728:1-24. doi: 10.1007/978-1-4614-0887-1_1. Adv Exp Med Biol. 2012. PMID: 22396159 Free PMC article. Review. - C-terminal tail of FGF19 determines its specificity toward Klotho co-receptors.
Wu X, Lemon B, Li X, Gupte J, Weiszmann J, Stevens J, Hawkins N, Shen W, Lindberg R, Chen JL, Tian H, Li Y. Wu X, et al. J Biol Chem. 2008 Nov 28;283(48):33304-9. doi: 10.1074/jbc.M803319200. Epub 2008 Oct 1. J Biol Chem. 2008. PMID: 18829467 Free PMC article. - The Klotho gene family and the endocrine fibroblast growth factors.
Kurosu H, Kuro-o M. Kurosu H, et al. Curr Opin Nephrol Hypertens. 2008 Jul;17(4):368-72. doi: 10.1097/MNH.0b013e3282ffd994. Curr Opin Nephrol Hypertens. 2008. PMID: 18660672 Review. - Structures of β-klotho reveal a 'zip code'-like mechanism for endocrine FGF signalling.
Lee S, Choi J, Mohanty J, Sousa LP, Tome F, Pardon E, Steyaert J, Lemmon MA, Lax I, Schlessinger J. Lee S, et al. Nature. 2018 Jan 25;553(7689):501-505. doi: 10.1038/nature25010. Epub 2018 Jan 17. Nature. 2018. PMID: 29342135 Free PMC article. - The FGF metabolic axis.
Li X. Li X. Front Med. 2019 Oct;13(5):511-530. doi: 10.1007/s11684-019-0711-y. Epub 2019 Sep 7. Front Med. 2019. PMID: 31495905 Free PMC article. Review.
Cited by
- Exploring endocrine FGFs - structures, functions and biomedical applications.
Phan P, Ternier G, Edirisinghe O, Kumar TKS. Phan P, et al. Int J Biochem Mol Biol. 2024 Aug 25;15(4):68-99. doi: 10.62347/PALK2137. eCollection 2024. Int J Biochem Mol Biol. 2024. PMID: 39309613 Free PMC article. Review. - Hepatic function of glucagon-like peptide-1 and its based diabetes drugs.
Feng JN, Jin T. Feng JN, et al. Med Rev (2021). 2024 Jun 4;4(4):312-325. doi: 10.1515/mr-2024-0018. eCollection 2024 Aug. Med Rev (2021). 2024. PMID: 39135602 Free PMC article. Review. - Development of Zalfermin, a Long-Acting Proteolytically Stabilized FGF21 Analog.
Sass-Ørum K, Tagmose TM, Olsen J, Sjölander A, Wahlund PO, Han D, Vegge A, Reedtz-Runge S, Wang Z, Gao X, Wieczorek B, Lamberth K, Lykkegaard K, Nielsen PK, Thøgersen H, Yu M, Wang J, Drustrup J, Zhang X, Garibay P, Hansen K, Hansen AMK, Andersen B. Sass-Ørum K, et al. J Med Chem. 2024 Jul 25;67(14):11769-11788. doi: 10.1021/acs.jmedchem.4c00391. Epub 2024 Jul 16. J Med Chem. 2024. PMID: 39013015 Free PMC article. - Bile Acid Signaling in Metabolic and Inflammatory Diseases and Drug Development.
Li T, Chiang JYL. Li T, et al. Pharmacol Rev. 2024 Oct 16;76(6):1221-1253. doi: 10.1124/pharmrev.124.000978. Pharmacol Rev. 2024. PMID: 38977324 Review. - Causal Relationships Between Circulating Inflammatory Proteins and Obstructive Sleep Apnea: A Bidirectional Mendelian Randomization Study.
Chen Z, Zeng J, Pei X, Zhao J, Zhao F, Zhang G, Liang K, Li J, Zhao X. Chen Z, et al. Nat Sci Sleep. 2024 Jun 13;16:787-800. doi: 10.2147/NSS.S458637. eCollection 2024. Nat Sci Sleep. 2024. PMID: 38894977 Free PMC article.
References
- Araya, K., S. Fukumoto, R. Backenroth, Y. Takeuchi, K. Nakayama, N. Ito, N. Yoshii, Y. Yamazaki, T. Yamashita, J. Silver, T. Igarashi, and T. Fujita. 2005. A novel mutation in fibroblast growth factor 23 gene as a cause of tumoral calcinosis. J. Clin. Endocrinol Metab. 90:5523-5527. - PubMed
- Bottcher, R. T., and C. Niehrs. 2005. Fibroblast growth factor signaling during early vertebrate development. Endocr. Rev. 26:63-77. - PubMed
- Harmer, N. J., L. Pellegrini, D. Chirgadze, J. Fernandez-Recio, and T. L. Blundell. 2004. The crystal structure of fibroblast growth factor (FGF) 19 reveals novel features of the FGF family and offers a structural basis for its unusual receptor affinity. Biochemistry 43:629-640. - PubMed
- Holt, J. A., G. Luo, A. N. Billin, J. Bisi, Y. Y. McNeill, K. F. Kozarsky, M. Donahee, Y. Wang da, T. A. Mansfield, S. A. Kliewer, B. Goodwin, and S. A. Jones. 2003. Definition of a novel growth factor-dependent signal cascade for the suppression of bile acid biosynthesis. Genes Dev. 17:1581-1591. - PMC - PubMed
Publication types
MeSH terms
Substances
Grants and funding
- AG25326/AG/NIA NIH HHS/United States
- AG19712/AG/NIA NIH HHS/United States
- DK067158/DK/NIDDK NIH HHS/United States
- R01 AG019712/AG/NIA NIH HHS/United States
- GM38060-17/GM/NIGMS NIH HHS/United States
- DK063934/DK/NIDDK NIH HHS/United States
- R01 HL052622/HL/NHLBI NIH HHS/United States
- S10 RR017990/RR/NCRR NIH HHS/United States
- R01 HL062244/HL/NHLBI NIH HHS/United States
- R01 DK067158/DK/NIDDK NIH HHS/United States
- P30 NS050276/NS/NINDS NIH HHS/United States
- R01 GM038060/GM/NIGMS NIH HHS/United States
- DE13686/DE/NIDCR NIH HHS/United States
- R01 DE013686/DE/NIDCR NIH HHS/United States
- HL62244/HL/NHLBI NIH HHS/United States
- R01 DK063934/DK/NIDDK NIH HHS/United States
- R01 AG025326/AG/NIA NIH HHS/United States
LinkOut - more resources
Full Text Sources
Other Literature Sources
Molecular Biology Databases
