Dynamic regulation of miRNA expression in ordered stages of cellular development - PubMed (original) (raw)
Dynamic regulation of miRNA expression in ordered stages of cellular development
Joel R Neilson et al. Genes Dev. 2007.
Abstract
Short RNA expression in several distinct stages of T-lymphocyte development was comprehensively profiled. The total number of microRNAs (miRNAs) expressed per cell at different stages of development varies over nearly an order of magnitude in parallel with changes in total cellular RNA content, suggesting that global miRNA levels are coregulated with the translational capacity of the cell. However, individual miRNAs were dynamically regulated during T-cell development, with at least one miRNA or miRNA family overrepresented at each developmental stage. miRNA regulation in this developmental pathway is characterized by analog rather than switch-like behavior, with temporal enrichments at distinct stages of development observed against a background of constant, basal expression of the miRNA. Enrichments of these miRNAs are temporally correlated with depletions of the transcript levels of targets containing seed matches to the specific miRNAs, and may have specific functional consequences. miR-181a, which is specifically enriched at the CD4(+)CD8(+) (DP) stage of thymocyte development, can repress the expression of Bcl-2, CD69, and the T-cell receptor, all of which are coordinately involved in positive selection.
Figures
Figure 1.
Measurements of total RNA content per cell, miRNAs per cell, and miRNAs per total RNA content. Values were derived from cell counts, total RNA quantification, and measurement of the concentration of individual miRNAs in each cell type normalized to a recovery control. The calculated miRNA pool represents an estimate based on the average of constants relating miRNA copy number to cloning frequency. Additional data is in SOM7–9. We were not able to obtain enough DN1 cells to perform miRNA quantitation analysis.
Figure 2.
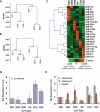
miRNA expression is dynamically regulated during thymocyte development. Rooted trees were generated from miRNA and mRNA expression data derived from each thymocyte population. (A) Relationship of cells determined by Spearman correlation of miRNA profiles. (B) Relationship of cells determined by Spearman correlation of mRNA profiles (Hoffmann et al. 2003). Values at branch points in A and B denote multiscale bootstrapping significance values. (C) Heat map representing relative expression of the 21 miRNAs that were identified as enriched or depleted during thymocyte development by the χ2 test. (Asterisks) Statistically significant enrichment or depletion. (D) qRT–PCR analysis of pri-miR-142 in thymocyte populations. (E) qRT–PCR analysis of ADAR family members in thymocyte populations.
Figure 3.
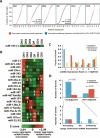
Genomic signatures in response to changes in miRNA family member dxpression. (A) Cumulative distribution plots of relative expression of transcripts with 3′ UTR elements harboring matches to position 2–8 of the seed region of the miR-181 family versus sets of control heptamers at each stage of thymocyte development. (B) χ2 analysis of aggregate expression of miRNA family members. (Arrows) Significant (p < 0.05) enrichment (up) or depletion (down) of transcripts containing seed-match heptamers relative to a cohort of sets of transcripts containing control heptamers with similar (±10) occurrence; (asterisks) statistically significant enrichment or depletion of the indicated miRNA family. (C) Enrichment and depletion of transcripts containing heptamer seed matches relative to control sequences in relation to ranked relative miRNA expression in the six cell populations examined. Results for the 20 significantly changed miRNA families shown in B are presented. (D) Temporal analysis of enrichments and depletions during thymocyte development relative to stage of maximum miRNA family aggregate expression. Significance of these enrichments when compared with 1000 randomizations of the data set is shown.
Figure 4.
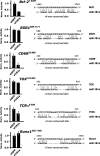
Repression of predicted miR-181a target UTRs in a reporter assay. The 3′ UTR elements of several genes identified by the Targetscan 3.0 server (Lewis et al. 2005) as potential miR-181a targets were tested in a dual-luciferase assay. An alignment of the conserved seed matches is indicated for each predicted target. Graphs indicate expression of the construct in HeLa cells transfected with a control siRNA duplex versus a miR-181a duplex normalized to the effect of each siRNA on a control UTR in a dual luciferase assay. UTR fragment length and miR-181a target sites are indicated. Results are representative of a minimum of three independent experiments performed in triplicate. Error bars represent one SD.
Figure 5.
Dysregulation of CD69 and the TCR in Dicer-deficient DP thymocytes. CD69 (A) and TCR (B) staining on electronically gated DP thymocytes from lck-cre+ and control Dicerf/f mice. Derepression was normalized via median fluorescence intensity (bar graphs). (C) CD69 levels on GFPhi and GFPneg Dicerf/f DP thymocytes transfected with a miR-181a or control siRNA. (D) As in C, examining lck-cre+ Dicerf/f DP thymocytes. Median fluorescence intensities for each parameter are provided in SOM16. Results are representative of a minimum of three individual experiments.
Similar articles
- A miRNA signature of prion induced neurodegeneration.
Saba R, Goodman CD, Huzarewich RL, Robertson C, Booth SA. Saba R, et al. PLoS One. 2008;3(11):e3652. doi: 10.1371/journal.pone.0003652. Epub 2008 Nov 6. PLoS One. 2008. PMID: 18987751 Free PMC article. - Preliminary analysis of miRNA pathway in Schistosoma mansoni.
Gomes MS, Cabral FJ, Jannotti-Passos LK, Carvalho O, Rodrigues V, Baba EH, Sá RG. Gomes MS, et al. Parasitol Int. 2009 Mar;58(1):61-8. doi: 10.1016/j.parint.2008.10.002. Epub 2008 Oct 28. Parasitol Int. 2009. PMID: 19007911 - Prediction and verification of miRNA expression in human and rat retinas.
Arora A, McKay GJ, Simpson DA. Arora A, et al. Invest Ophthalmol Vis Sci. 2007 Sep;48(9):3962-7. doi: 10.1167/iovs.06-1221. Invest Ophthalmol Vis Sci. 2007. PMID: 17724173 - MicroRNAs and immunity: novel players in the regulation of normal immune function and inflammation.
Sonkoly E, Ståhle M, Pivarcsi A. Sonkoly E, et al. Semin Cancer Biol. 2008 Apr;18(2):131-40. doi: 10.1016/j.semcancer.2008.01.005. Epub 2008 Jan 15. Semin Cancer Biol. 2008. PMID: 18291670 Review. - MicroRNAs: all gone and then what?
Hobert O. Hobert O. Curr Biol. 2005 May 24;15(10):R387-9. doi: 10.1016/j.cub.2005.05.006. Curr Biol. 2005. PMID: 15916942 Review.
Cited by
- Demethylation of miR-34a upregulates expression of membrane palmitoylated proteins and promotes the apoptosis of liver cancer cells.
Li FY, Fan TY, Zhang H, Sun YM. Li FY, et al. World J Gastroenterol. 2021 Feb 14;27(6):470-486. doi: 10.3748/wjg.v27.i6.470. World J Gastroenterol. 2021. PMID: 33642822 Free PMC article. - Adipocyte, Immune Cells, and miRNA Crosstalk: A Novel Regulator of Metabolic Dysfunction and Obesity.
Kiran S, Kumar V, Kumar S, Price RL, Singh UP. Kiran S, et al. Cells. 2021 Apr 24;10(5):1004. doi: 10.3390/cells10051004. Cells. 2021. PMID: 33923175 Free PMC article. Review. - miR-24, miR-30b and miR-142-3p interfere with antigen processing and presentation by primary macrophages and dendritic cells.
Naqvi AR, Fordham JB, Ganesh B, Nares S. Naqvi AR, et al. Sci Rep. 2016 Sep 9;6:32925. doi: 10.1038/srep32925. Sci Rep. 2016. PMID: 27611009 Free PMC article. - Delving into the diversity of silencing pathways. Symposium on MicroRNAs and siRNAs: biological functions and mechanisms.
Dorner S, Eulalio A, Huntzinger E, Izaurralde E. Dorner S, et al. EMBO Rep. 2007 Aug;8(8):723-9. doi: 10.1038/sj.embor.7401015. Epub 2007 Jun 29. EMBO Rep. 2007. PMID: 17599087 Free PMC article. No abstract available. - Circulating microRNAs as minimal residual disease biomarkers in childhood acute lymphoblastic leukemia.
Rzepiel A, Kutszegi N, Gézsi A, Sági JC, Egyed B, Péter G, Butz H, Nyírő G, Müller J, Kovács GT, Szalai C, Semsei ÁF, Erdélyi DJ. Rzepiel A, et al. J Transl Med. 2019 Nov 14;17(1):372. doi: 10.1186/s12967-019-2114-x. J Transl Med. 2019. PMID: 31727091 Free PMC article.
References
- Alfonso C., McHeyzer-Williams M.G., Rosen H., McHeyzer-Williams M.G., Rosen H., Rosen H. CD69 down-modulation and inhibition of thymic egress by short- and long-term selective chemical agonism of sphingosine 1-phosphate receptors. Eur. J. Immunol. 2006;36:149–159. - PubMed
- Aravin A., Tuschl T., Tuschl T. Identification and characterization of small RNAs involved in RNA silencing. FEBS Lett. 2005;579:5830–5840. - PubMed
- Bagga S., Bracht J., Hunter S., Massirer K., Holtz J., Eachus R., Pasquinelli A.E., Bracht J., Hunter S., Massirer K., Holtz J., Eachus R., Pasquinelli A.E., Hunter S., Massirer K., Holtz J., Eachus R., Pasquinelli A.E., Massirer K., Holtz J., Eachus R., Pasquinelli A.E., Holtz J., Eachus R., Pasquinelli A.E., Eachus R., Pasquinelli A.E., Pasquinelli A.E. Regulation by let-7 and lin-4 miRNAs results in target mRNA degradation. Cell. 2005;122:553–563. - PubMed
- Bonifacino J.S., McCarthy S.A., Maguire J.E., Nakayama T., Singer D.S., Klausner R.D., Singer A., McCarthy S.A., Maguire J.E., Nakayama T., Singer D.S., Klausner R.D., Singer A., Maguire J.E., Nakayama T., Singer D.S., Klausner R.D., Singer A., Nakayama T., Singer D.S., Klausner R.D., Singer A., Singer D.S., Klausner R.D., Singer A., Klausner R.D., Singer A., Singer A. Novel post-translational regulation of TCR expression in CD4+CD8+ thymocytes influenced by CD4. Nature. 1990;344:247–251. - PubMed
Publication types
MeSH terms
Substances
LinkOut - more resources
Full Text Sources
Other Literature Sources
Research Materials


