Uncoupling proteins 2 and 3 are fundamental for mitochondrial Ca2+ uniport - PubMed (original) (raw)
Uncoupling proteins 2 and 3 are fundamental for mitochondrial Ca2+ uniport
Michael Trenker et al. Nat Cell Biol. 2007 Apr.
Erratum in
- Nat Cell Biol. 2008 Nov;10(11):1371
Abstract
Mitochondrial Ca(2+) uptake is crucial for the regulation of the rate of oxidative phosphorylation, the modulation of spatio-temporal cytosolic Ca(2+) signals and apoptosis. Although the phenomenon of mitochondrial Ca(2+) sequestration, its characteristics and physiological consequences have been convincingly reported, the actual protein(s) involved in this process are unknown. Here, we show that the uncoupling proteins 2 and 3 (UCP2 and UCP3) are essential for mitochondrial Ca(2+) uptake. Using overexpression, knockdown (small interfering RNA) and mutagenesis experiments, we demonstrate that UCP2 and UCP3 are elementary for mitochondrial Ca(2+) sequestration in response to cell stimulation under physiological conditions - observations supported by isolated liver mitochondria of Ucp2(-/-) mice lacking ruthenium red-sensitive Ca(2+) uptake. Our results reveal a novel molecular function for UCP2 and UCP3, and may provide the molecular mechanism for their reported effects. Moreover, the identification of proteins fundemental for mitochondrial Ca(2+) uptake expands our knowledge of the physiological role for mitochondrial Ca(2+) sequestration.
Figures
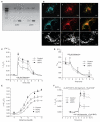
Figure 1. Expression of UCP orthologues and functional tests on Ca2+ carrier function of UCP2 or UCP3 in human endothelial cells.
(A) RT–PCR of UCPs in EA.hy926 (EA) cells and human white adipose tissue (WAT). Methods and primer sequences are available shown in the Supplementary Information, Methods. (B) Targeting of fusion proteins of UCP2 and UCP3. a and d show the localization of the fusion constructs of UCP2 and UCP3; b and e the localization of mito-tracker orange; and c and f the colocalization in the respective cell. Mitochondria structure was visualized in endothelial cells transfected with mitochondria-targeted DsRed (g) or DsRed and UCP2 alone (h). Further information is shown in the Supplementary Information, Fig. S1b. For comparison with mitochondrial fragmentation, DsRed transfected cells were treated with 2 μM FCCP for 5 min (i). The scale bars represent 10 μm in a-f and 2 μm in g–i. (C) UCP2 and UCP3 overexpression increased mitochondrial Ca2+ uptake. Mitochondrial Ca2+ elevation in response to 100 μM histamine was measured with mitochondria-targeted ratiometric-pericam in intact endothelial cells overexpressing the sensor, either alone (control; n = 32) or together with UCP2 (n = 23) or UCP3 (n = 18). The asterisk indicates P <0.05 versus control. (D) UCP2 and UCP3 overexpression had no effect on histamine-induced changes in the mainly pH-sensitive wavelength of pericam (F485; data shown correspond to that shown in C). (E) UCP2 and UCP3 increased capacity, but not sensitivity, of mitochondrial Ca2+ uptake. Concentration response curves of histamine on mitochondrial Ca2+ elevation were obtained in single endothelial cells overexpressing mitochondria-targeted ratiometric pericam either alone (control, n = 6–12) or together with UCP2 (n = 6–12) or UCP3 (n = 6–12). The asterisk indicates P <0.05 versus control. The respective data on cytosolic Ca2+ concentration are shown in the Supplementary Information, Fig. S1k. (F) UCP2 and UCP3 increased mitochondrial Ca2+ uptake independently of mitochondrial pH, mitochondrial Na+–Ca2+ exchanger or mitochondrial membrane potential. In single endothelial cells overexpressing UCP2 (n = 11) or UCP3 (n = 14) mitochondria were depolarized by 2 μM FCCP and 2 μM oligomycin and the mitochondrial Na+–Ca2+ exchanger was inhibited by CGP 37157, as described previously. The asterisk indicates P <0.05 versus control (n = 14). The error bars represent s.e.m.
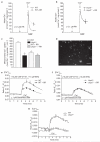
Figure 2. UCP2 or UCP3 knockdown by siRNAs resulted in diminution and/or elimination of mitochondrial Ca2+ uptake.
(a) siRNAs against UCP2 or UCP3 (see Supplementary Information, Fig. S2a) diminished expression of the respective protein, indicated by western blot analysis. The bars indicate the optical density of the respective band in lower panels, which are normalized according the corresponding β-actin band. Representative blots from three independent experiments are shown. (b) Silencing UCP2 and/or UCP3 expression attenuated and/or eliminated mitochondrial Ca2+ uptake. Mitochondrial Ca2+ sequestration in response to histamine was measured in single mitochondria-targeted ratiometric pericam-transfected endothelial cells that were cotransfected with control siRNA (see Supplementary Information, Methods), or with siRNAs against UCP2 and/or UCP3. Average curves are shown on the left (control, n = 16; UCP2 siRNA, n = 17; UCP3 siRNA, n = 17; and UCP2/3 siRNA, n = 22). The distribution of individual independent experiments is shown on the right. The bars indicate the mean value. The single asterisk indicates P <0.05 versus control and the double asterisk indicates P <0.05 versus cells transfected with UCP2 siRNA. The corresponding data on cytosolic free Ca2+ are provided in the Supplementary Information, Fig. S2b. (c) In single HeLa cells, which express UCP3 but not UCP2 (see Supplementary Information, Fig. S1a), only the UCP3 siRNA (n = 14) was suitable to prevent mitochondrial Ca2+ sequestration. The asterisk indicates P <0.05 versus control (n = 12) and UCP2 siRNA (n = 9). (d) In single HeLa cells transfected with UCP3 siRNA (n = 10), overexpression of UCP2 rescued mitochondrial Ca2+ uptake, as monitored with cotransfected mitochondria-targeted ratiometric-pericam. The asterisk indicates P <0.05 versus control (n = 11) and UCP2 + UCP3 siRNA (n = 10). (e) Overexpression of UCP2 rescued mitochondrial Ca2+ uptake in suspended digitonin-permeabilized HeLa cells that were transfected with UCP3 siRNA (n = 6). Calcium Green-5N (0.1 μM) was used to measure the reduction of extra-mitochondrial Ca2+ by mitochondria in digitonin-permeabilized and suspended HeLa cells, which were transiently transfected with either the vector alone (control), UCP3 siRNA or UCP2 + UCP3 siRNA. As indicated (arrows), 5 μM digititonin (Dig.), 90 nmol Ca2+ and 2 μM FCCP were added in the presence of 1 μM thapsigargin. The asterisk indicates P <0.05 versus control (n = 6) and UCP2 + UCP3 siRNA (n = 6). The error bars represent s.e.m.
Figure 3. In isolated liver mitochondria from Ucp2−/− mice, no ruthenium red (RR)-sensitive Ca2+ uniporter exists.
(a) Ca2+ uptake of suspended isolated liver mitochondria from wild-type (WT) animals was measured by monitoring the reduction of extra-mitochondrial Ca2+ on application of 140 nmol Ca2+ mg−1 mitochondrial protein with Calcium Green-5N (0.1 μM). Experiments were performed in the absence (n = 7) and presence (WT + RR, n = 4; single asterisk indicates P <0.05 versus WT) of ruthenium red, an established inhibitor of mitochondrial Ca2+ uniporter (100 nM). (b) In suspended liver mitochondria isolated from Ucp2−/− mice, Ca2+ uptake (measured as described in a), was reduced (Ucp2−/−; n = 7). The remaining Ca2+ uptake was insensitive to ruthenium red (100 nM; Ucp2−/− + RR; n = 4). n.s. versus Ucp2−/−. (c) Kinetics of mitochondrial Ca2+ uptake within 30 s after addition of Ca2+ calculated from the data presented in a and b. The asterisk indicates P <0.05 versus WT. (d) Fluorescence image of fura-2 loaded single mitochondria freshly isolated from mouse liver. The scale bar represents 10 μm. (e) In isolated single liver mitochondria from wild-type animals, mitochondrial Ca2+ sequestration was measured in the absence (WT, n = 44) and presence (WT + RR, n = 22) of ruthenium red (1 μM) by mitochondrial fura-2. The asterisk indicates P <0.05 versus WT. (f) Ca2+ uptake in isolated single mitochondria from Ucp2−/− mice measured by mitochondrial fura-2 was reduced (Ucp2−/−, n = 34) compared with that obtained in the wild-type littermates. The remaining Ca2+ uptake into the liver mitochondria of Ucp2−/− mice was not ruthenium red-sensitive (Ucp2−/− + RR, n = 21). n.s. versus Ucp2−/−. (g) Ruthenium red-sensitive mitochondrial Ca2+ uptake in single mitochondria freshly isolated from wild-type and Ucp2−/− (Ucp2−/−, asterisk indicates P <0.05 versus WT) mice calculated from data in e and f. The error bars represent s.e.m (a–f) or indicate 95% confidencence intervals at the times shown (g).
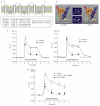
Figure 4. Mutagenesis of UCP2 and UCP3 resulted in loss of Ca2+ function of the proteins and provided dominant-negative UCP homologues.
(a) Sequence alignment and identification of specific domains common for UCP2 and UCP3, but not UCP1. Additional information is shown in the Supplementary Information. (b) Using the ROBETTA full-chain protein structure prediction server (
), the protein structure of UCP2 and UCP3 was predicted to form a channel-like structure. As indicated, the mutation was introduced in a helix that is located on the matrix side of the inner mitochondrial membrane and results in shortening of the helix loop and loss of polarity. (c) Functional consequences on mitochondrial Ca2+ uptake in single endothelial cells transiently expressing mitochondria-targeted ratiometric-pericam overexpressing mutated UCP2 (n = 25) or mutated UCP3 (n = 15). The asterisk indicates P <0.05 versus control (n = 17). (d) Mutated UCP2 failed to rescue mitochondrial Ca2+ uptake in single HeLa cells transfected with UCP3 siRNA. HeLa cells were transfected with either a non-functional control siRNA (n = 14), UCP3 siRNA (n = 9) or UCP3 siRNA together with mutated UCP2 (UCP2mut + UCP3 siRNA, n = 9). Asterisk indicates P <0.05 versus control siRNA.
Comment in
- UCPs--unlikely calcium porters.
Brookes PS, Parker N, Buckingham JA, Vidal-Puig A, Halestrap AP, Gunter TE, Nicholls DG, Bernardi P, Lemasters JJ, Brand MD. Brookes PS, et al. Nat Cell Biol. 2008 Nov;10(11):1235-7; author reply 1237-40. doi: 10.1038/ncb1108-1235. Nat Cell Biol. 2008. PMID: 18978830 Free PMC article. No abstract available.
Similar articles
- The contribution of UCP2 and UCP3 to mitochondrial Ca(2+) uptake is differentially determined by the source of supplied Ca(2+).
Waldeck-Weiermair M, Malli R, Naghdi S, Trenker M, Kahn MJ, Graier WF. Waldeck-Weiermair M, et al. Cell Calcium. 2010 May;47(5):433-40. doi: 10.1016/j.ceca.2010.03.004. Epub 2010 Apr 18. Cell Calcium. 2010. PMID: 20403634 - Uncoupling protein 3 adjusts mitochondrial Ca(2+) uptake to high and low Ca(2+) signals.
Waldeck-Weiermair M, Duan X, Naghdi S, Khan MJ, Trenker M, Malli R, Graier WF. Waldeck-Weiermair M, et al. Cell Calcium. 2010 Nov;48(5):288-301. doi: 10.1016/j.ceca.2010.10.004. Epub 2010 Nov 2. Cell Calcium. 2010. PMID: 21047682 Free PMC article. - Leucine zipper EF hand-containing transmembrane protein 1 (Letm1) and uncoupling proteins 2 and 3 (UCP2/3) contribute to two distinct mitochondrial Ca2+ uptake pathways.
Waldeck-Weiermair M, Jean-Quartier C, Rost R, Khan MJ, Vishnu N, Bondarenko AI, Imamura H, Malli R, Graier WF. Waldeck-Weiermair M, et al. J Biol Chem. 2011 Aug 12;286(32):28444-55. doi: 10.1074/jbc.M111.244517. Epub 2011 May 25. J Biol Chem. 2011. PMID: 21613221 Free PMC article. - Reconstitution of novel mitochondrial uncoupling proteins UCP2 and UCP3.
Záckova M, Jezek P. Záckova M, et al. Biosci Rep. 2002 Feb;22(1):33-46. doi: 10.1023/a:1016009022186. Biosci Rep. 2002. PMID: 12418549 Review. - The reactions catalysed by the mitochondrial uncoupling proteins UCP2 and UCP3.
Esteves TC, Brand MD. Esteves TC, et al. Biochim Biophys Acta. 2005 Aug 15;1709(1):35-44. doi: 10.1016/j.bbabio.2005.06.002. Biochim Biophys Acta. 2005. PMID: 16005426 Review.
Cited by
- Mitochondrial Ca2+ uptake pathways.
Elustondo PA, Nichols M, Robertson GS, Pavlov EV. Elustondo PA, et al. J Bioenerg Biomembr. 2017 Feb;49(1):113-119. doi: 10.1007/s10863-016-9676-6. Epub 2016 Sep 24. J Bioenerg Biomembr. 2017. PMID: 27665468 Review. - Genetic deletion of uncoupling protein 3 exaggerates apoptotic cell death in the ischemic heart leading to heart failure.
Perrino C, Schiattarella GG, Sannino A, Pironti G, Petretta MP, Cannavo A, Gargiulo G, Ilardi F, Magliulo F, Franzone A, Carotenuto G, Serino F, Altobelli GG, Cimini V, Cuocolo A, Lombardi A, Goglia F, Indolfi C, Trimarco B, Esposito G. Perrino C, et al. J Am Heart Assoc. 2013 May 20;2(3):e000086. doi: 10.1161/JAHA.113.000086. J Am Heart Assoc. 2013. PMID: 23688674 Free PMC article. - SLC25A23 augments mitochondrial Ca²⁺ uptake, interacts with MCU, and induces oxidative stress-mediated cell death.
Hoffman NE, Chandramoorthy HC, Shanmughapriya S, Zhang XQ, Vallem S, Doonan PJ, Malliankaraman K, Guo S, Rajan S, Elrod JW, Koch WJ, Cheung JY, Madesh M. Hoffman NE, et al. Mol Biol Cell. 2014 Mar;25(6):936-47. doi: 10.1091/mbc.E13-08-0502. Epub 2014 Jan 15. Mol Biol Cell. 2014. PMID: 24430870 Free PMC article. - SNPs for Genes Encoding the Mitochondrial Proteins Sirtuin3 and Uncoupling Protein 2 Are Associated With Disease Severity, Type 2 Diabetes, and Outcomes in Patients With Pulmonary Arterial Hypertension and This Is Recapitulated in a New Mouse Model Lacking Both Genes.
Zhang Y, Zervopoulos SD, Boukouris AE, Lorenzana-Carrillo MA, Saleme B, Webster L, Liu Y, Haromy A, Tabatabaei Dakhili SA, Ussher JR, Sutendra G, Michelakis ED. Zhang Y, et al. J Am Heart Assoc. 2021 Dec 7;10(23):e020451. doi: 10.1161/JAHA.120.020451. Epub 2021 Oct 30. J Am Heart Assoc. 2021. PMID: 34719264 Free PMC article. - Fatty acids do not activate UCP2 in pancreatic beta cells: comparison with UCP1.
Galetti S, Sarre A, Perreten H, Produit-Zengaffinen N, Muzzin P, Assimacopoulos-Jeannet F. Galetti S, et al. Pflugers Arch. 2009 Feb;457(4):931-40. doi: 10.1007/s00424-008-0548-8. Epub 2008 Jul 15. Pflugers Arch. 2009. PMID: 18626658
References
- Malli R, Frieden M, Trenker M, Graier WF. The role of mitochondria for Ca2+ refilling of the ER. J. Biol. Chem. 2005;280:12114–12122. - PubMed
- Parekh AB. Slow feedback inhibition of calcium release-activated calcium current by calcium entry. J. Biol. Chem. 1998;273:14925–14932. - PubMed
- Gunter TE, Buntinas L, Sparagna G, Eliseev R, Gunter K. Mitochondrial calcium transport: mechanisms and functions. Cell Calcium. 2000;28:285–296. - PubMed
Publication types
MeSH terms
Substances
LinkOut - more resources
Full Text Sources
Other Literature Sources
Miscellaneous


