Astroglial heterogeneity closely reflects the neuronal-defined anatomy of the adult murine CNS - PubMed (original) (raw)
Astroglial heterogeneity closely reflects the neuronal-defined anatomy of the adult murine CNS
Jason G Emsley et al. Neuron Glia Biol. 2006 Aug.
Abstract
Astroglia comprise an extremely morphologically diverse cell type that have crucial roles in neural development and function. Nonetheless, distinct regions of the CNS have traditionally been defined by the phenotypic characteristics and connectivity of neuros. In a complementary fashion, we present evidence that discrete regions of the adult CNS can be delineated based solely on the morphology, density and proliferation rates of astroglia. We used transgenic hGFAP-GFP mice in which robust expression of GFP in adult astroglia enables detailed morphological characterization of this diversely heterogeneous cell population with 3D confocal microscopy. By using three complementary methods for labeling adult astroglia (hGFAP-GFP expression, and GFAP and S100beta immunostaining), we find that there is a remarkably diverse, regionally stereotypical array of astroglial morphology throughout the CNS, and that discrete anatomical regions can be defined solely on the morphology of astroglia within that region. Second, we find that the density of astroglia varies dramatically across the CNS, and that astroglial density effectively delineates even the sub-regions of complex structures, such as the thalamus. We also find that regional astroglial density varies depending on how astroglia are labeled. To quantify and illustrate these broad differences in astroglial density, we generated an anatomical density atlas of the CNS. Third, the proliferation rate, or mitotic index, of astroglia in the adult CNS also effectively defines anatomical regions. These differences are present regardless of the astroglial-labeling method used. To supplement our atlas of astroglial density we generated an atlas of proliferation density for the adult CNS. Together, these studies demonstrate that the morphology, density and proliferation rate of astroglia can independently define the discrete cytoarchitecture of the adult mammalian CNS, and support the concept that regional astroglial heterogeneity reflects important molecular and functional differences between distinct classes of astroglia, much like the long-accepted heterogeneity of neuronal populations.
Figures
Fig. 1. Different labeling methods highlight the considerable variability in astroglial morphology
(A) Composite image of astroglia stained with S100β (red), GFAP (blue), and hGFAP-GFP (green). DAPI nuclear counterstain is light teal. A protoplasmic astrocyte (arrow) is co-labeled with hGFAP-GFP and GFAP. S100β-positive astroglia (arrowheads), surrounding the hGFAP-GFP- and the GFAP-positive astroglia, have shorter, less arborized processes than their hGFAP-GFP- and GFAP-positive counterparts. *, cells not stained for any of the three labels. (B–D) Rendered micrographs produced from confocal image stacks of the adult forebrain that show somata (arrows) and arborizations (arrowheads) as detected by the presence of S100β, GFAP and hGFAP-GFP. Note the increased number of fibrous processes that are visible using GFAP immunostaining, and the intense arborization and the full, round soma in transgenically-labeled glia. Blue, DAPI nuclear counterstain. Scale bars: A, 25 μm; B (for B–D), 10 μm.
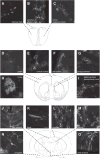
Fig. 2. Astroglial morphology varies considerably between defined CNS regions
Representative astroglia from selected regions of the adult mouse CNS. Each image was serially reconstructed from confocal image stacks at either 20× or 60× magnification with or without optical zoom. Schematic images at defined antero-posterior (AP) axis locations (Franklin and Paxinos, 1997) provide orientation to the confocal micrographs.
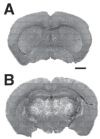
Fig. 3. Astroglial cell density varies substantially between CNS regions
Sample montages of sections from the striatal level (A) and hippocampal/thalamic level (B) from which astroglial density data were derived. Fluorescence is native GFP driven by the hGFAP promoter. Scale bar, 1 mm.
Fig. 4. An atlas of cell density using the three labeling methods
Schematic, rostral-to-caudal, density-atlas sections demonstrate that astroglial density varies considerably in the adult CNS. Antero-posterior (AP) coordinates, in mm from Bregma, are indicated above the schematics. The colorimetric density gradient (top) represents increasing density (defined as the number of astroglia per mm2 in 30 μm sections). Schematic representations of neuronally defined regions are based on Franklin and Paxinos (1997). Abbreviations: am, amygdala; cc, corpus callosum; cl, claustrum; ctx, cortex; dr; dorsal root, spinal cord; fi, fimbria; fmi, forceps minor, corpus callosum; fo, fornix; gc, granule cell layer, cerebellum; gl, glomerular cell layer, olfactory bulb; gm; grey matter, spinal cord; gp, globus pallidus; gr, granule cell layer, olfactory bulb; hpc, hippocampus; hyp, hypothalamus; ic, internal capsule; ls, lateral septal nucleus; mg, medial geniculate nucleus, thalamus; ml, molecular layer, cerebellum; mm, mammilary nucleus; na, nucleus accumbens; po, preoptic nucleus, hypothalamus; sc, superior colliculus; sn, substantia nigra; str, striatum; vp, ventral pallidum; wm, white matter, spinal cord; zi, zona incerta.
Fig. 5. Astroglial proliferation rates vary substantially across the adult CNS
The proliferation of astroglia in several regions was assessed by a 1-week administration of the thymidine analog BrdU. (A) A pair of recently born velate astroglia (arrows). BrdU-positive/hGFAP-GFP-negative cells in (A) are marked with asterisks. (B) An example of a recently generated eGFP-positive cell (arrow) in the neocortex. An adjacent protoplasmic astrocyte was not generated during the BrdU administration period (arrowhead). (C) The proliferation rate of astroglia varies substantially across the adult CNS, and also depends on the labeling method. Schematic, rostro-caudal atlas sections (Franklin and Paxinos, 1997) with proliferation rates displayed demonstrate that astroglial-turnover rates range from almost zero (in the cerebellum) to ~15–20% (e.g. in the corpus callosum and hippocampus). The colorimetric gradient on the left represents increasing proliferation rate (expressed as the percentage of GFP-, GFAP- and S100β-positive/BrdU-positive cells mm−2 in 30 μm sections) of all GFP-, GFAP- and S100β-positive cells). Scale bars: A, 25 μm; B, 50 μm.
Similar articles
- Microarray analyses reveal regional astrocyte heterogeneity with implications for neurofibromatosis type 1 (NF1)-regulated glial proliferation.
Yeh TH, Lee DY, Gianino SM, Gutmann DH. Yeh TH, et al. Glia. 2009 Aug 15;57(11):1239-49. doi: 10.1002/glia.20845. Glia. 2009. PMID: 19191334 Free PMC article. - Neuron-astroglial interactions in vitro and their implications for repair of CNS injury.
Hatten ME, Mason CA, Liem RK, Edmondson JC, Bovolenta P, Shelanski ML. Hatten ME, et al. Cent Nerv Syst Trauma. 1984 Fall;1(1):15-27. doi: 10.1089/cns.1984.1.15. Cent Nerv Syst Trauma. 1984. PMID: 6400196 Review. - Neuronal inhibition of astroglial cell proliferation is membrane mediated.
Hatten ME. Hatten ME. J Cell Biol. 1987 May;104(5):1353-60. doi: 10.1083/jcb.104.5.1353. J Cell Biol. 1987. PMID: 3571332 Free PMC article.
Cited by
- Genetic ablation of Nrf2/antioxidant response pathway in Alexander disease mice reduces hippocampal gliosis but does not impact survival.
Hagemann TL, Jobe EM, Messing A. Hagemann TL, et al. PLoS One. 2012;7(5):e37304. doi: 10.1371/journal.pone.0037304. Epub 2012 May 31. PLoS One. 2012. PMID: 22693571 Free PMC article. - 3D Reconstruction of the Neurovascular Unit Reveals Differential Loss of Cholinergic Innervation in the Cortex and Hippocampus of the Adult Mouse Brain.
Nizari S, Carare RO, Romero IA, Hawkes CA. Nizari S, et al. Front Aging Neurosci. 2019 Jul 4;11:172. doi: 10.3389/fnagi.2019.00172. eCollection 2019. Front Aging Neurosci. 2019. PMID: 31333445 Free PMC article. - The Influence of Striatal Astrocyte Dysfunction on Locomotor Activity in Dopamine-depleted Rats.
Voronkov D, Stavrovskaya A, Olshanskiy A, Guschina A, Khudoerkov R, Illarioshkin S. Voronkov D, et al. Basic Clin Neurosci. 2021 Nov-Dec;12(6):767-776. doi: 10.32598/bcn.2021.1923.1. Epub 2021 Nov 1. Basic Clin Neurosci. 2021. PMID: 35693141 Free PMC article. - Astrocyte morphology: Diversity, plasticity, and role in neurological diseases.
Zhou B, Zuo YX, Jiang RT. Zhou B, et al. CNS Neurosci Ther. 2019 Jun;25(6):665-673. doi: 10.1111/cns.13123. Epub 2019 Mar 30. CNS Neurosci Ther. 2019. PMID: 30929313 Free PMC article. Review. - No Longer Underappreciated: The Emerging Concept of Astrocyte Heterogeneity in Neuroscience.
Pestana F, Edwards-Faret G, Belgard TG, Martirosyan A, Holt MG. Pestana F, et al. Brain Sci. 2020 Mar 13;10(3):168. doi: 10.3390/brainsci10030168. Brain Sci. 2020. PMID: 32183137 Free PMC article. Review.
References
- Amateau SK, McCarthy MM. Sexual differentiation of astrocyte morphology in the developing rat preoptic area. Journal of Neuroendocrinology. 2002;14:904–910. - PubMed
- Bailey MS, Shipley MT. Astrocyte subtypes in the rat olfactory bulb: morphological heterogeneity and differential laminar distribution. Journal of Comparative Neurology. 1993;328:501–526. - PubMed
- Barbin G, Katz DM, Chamak B, Glowinski J, Prochiantz A. Brain astrocytes express region-specific surface glycoproteins in culture. Glia. 1988;1:96–103. - PubMed
- Batter DK, Corpina RA, Roy C, Spray DC, Hertzberg EL, Kessler JA. Heterogeneity in gap junction expression in astrocytes cultured from different brain regions. Glia. 1992;6:213–221. - PubMed
- Beyer C, Epp B, Fassberg J, Reisert I, Pilgrim C. Region- and sex-related differences in maturation of astrocytes in dissociated cell cultures of embryonic rat brain. Glia. 1990;3:55–64. - PubMed
Grants and funding
- R01 NS041590/NS/NINDS NIH HHS/United States
- R01 NS045523/NS/NINDS NIH HHS/United States
- R01 NS049553/NS/NINDS NIH HHS/United States
- R37 NS041590/NS/NINDS NIH HHS/United States
LinkOut - more resources
Full Text Sources
Miscellaneous


