Concomitant activation of the JAK/STAT, PI3K/AKT, and ERK signaling is involved in leptin-mediated promotion of invasion and migration of hepatocellular carcinoma cells - PubMed (original) (raw)
Concomitant activation of the JAK/STAT, PI3K/AKT, and ERK signaling is involved in leptin-mediated promotion of invasion and migration of hepatocellular carcinoma cells
Neeraj K Saxena et al. Cancer Res. 2007.
Abstract
Various epidemiologic studies have shown that obesity is associated with hepatocellular carcinoma. Leptin, the key player in the regulation of energy balance and body weight control, also acts as a growth factor on certain organs in both normal and disease states. It is plausible that leptin acts to promote hepatocellular carcinogenesis directly affecting malignant properties of liver cancer cells. However, a direct role for leptin in hepatocellular carcinoma has not been shown. In this study, we analyzed the role of leptin and the mechanism(s) underlying its action in hepatocellular carcinoma cells, which express both short and long isoforms of leptin receptors. Treatment with leptin resulted in increased proliferation of both HepG2 and Huh7 cells and involves activation of signal transducers and activators of transcription 3 (STAT3), AKT, and extracellular signal-regulated kinase (ERK) signaling pathways. Leptin-induced phosphorylation of ERK and AKT was dependent on Janus-activated kinase (JAK)/STAT activation. Intriguingly, we also found that leptin potently induces invasion of hepatocellular carcinoma cells in Matrigel invasion and electric cell-substrate impedance-sensing assays. Leptin-stimulated invasion was effectively blocked by pharmacologic inhibitors of JAK/STAT and, to a lesser extent, by ERK and phosphatidylinositol 3-kinase (PI3K) inhibition. Importantly, leptin also induced the migration of both HepG2 and Huh7 cells on fibronectin matrix. Inhibition of JAK/STAT, ERK, and PI3K activation using pharmacologic inhibitors effectively blocked leptin-induced migration of HepG2 and Huh7 cells. Taken together, these data indicate that leptin promotes hepatocellular carcinoma growth, invasiveness, and migration and implicate the JAK/STAT pathway as a critical mediator of leptin action. Our findings have potential clinical implications for hepatocellular carcinoma progression in obese patients.
Figures
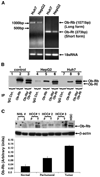
Figure 1. Leptin receptors are expressed in hepatocellular carcinoma cells and hepatocellular carcinoma tumor tissue from human
A, total RNA was extracted from HepG2 and Huh7 cells and analyzed by reverse transcription-PCR using specific primers for long (Ob-Rb) and short (Ob-Rt) isoforms of leptin receptor. Primer set for 18S RNA was used as a control. B, total protein was isolated from HepG2 and Huh7 cells, and equal amounts of proteins were subjected to immunoprecipitation using specific antibodies for long and short forms of leptin receptor. Immunoprecipitation with IgG was included as a negative control. Twenty-five micrograms of COLO 320DM cell lysate (Santa Cruz Biotechnology) were included as positive control. Immunoprecipitates were resolved by SDS-PAGE and subjected to immunoblot analysis using a mouse monoclonal antibody against both long and short forms of leptin receptor. Long (Ob-Rb; 120 kDa) and short (Ob-Rt; 90 kDa) forms of leptin receptors were found to be present in HepG2 and Huh7 cells. C, lysates from normal liver tissue (surrounding liver metastases), peritumoral tissue, and three cases of hepatocellular carcinoma (HCC) on liver with cirrhosis were prepared. Equal amounts of proteins were resolved by SDS-PAGE and subjected to immunoblot analysis using a mouse monoclonal antibody against the long form of leptin receptor. The long form (Ob-Rb) of leptin receptors was found to be present in all three cases of hepatocellular carcinoma. The expression was more in tumorous tissues (T) compared with peritumoral tissue (P). The normal liver tissue from two cases (NHL 1 and 2) were negative for the presence of Ob-Rb. Lysate from hepatic stellate cells (HSC) was used as positive control. The Western blot signals were quantified by densitometry (histogram) and normalized to β-actin.
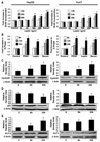
Figure 2. Leptin is mitogenic for hepatocellular carcinoma cells
A, HepG2 and Huh7 cells were serum-starved for 16 h followed by treatment with 25 to 200 ng/mL leptin for 12, 24, and 48 h. BrdUrd incorporation assays were then done as described in Materials and Methods. Leptin treatment increased proliferation of HepG2 and Huh7 cells in a time-and dose-dependent manner. *, P < 0.01, for different time and dose compared with respective untreated cells. Cells grown in 10% FBS were included as positive controls. Columns, mean of three independent experiments done in triplicates; bars, SE. B, leptin increased the fraction of HepG2 and Huh7 cells in the S phase of the cell cycle. Cells were synchronized by serum starvation in a medium containing 0.1% serum for 16 h. Serum-starved cells were exposed to platelet-derived growth factor (PDGF; 30 ng/mL) or leptin (100 ng/mL) for various time intervals (8, 12, and 24 h) or control serum-free media (0.1% FBS). After each time interval, the distribution of both HepG2 and Huh7 cells in the cell cycle was determined by flow cytometry using propidium iodide–stained nuclei. The results indicate the distribution of hepatocellular carcinoma cells in various phases after serum starvation, leptin, or platelet-derived growth factor treatment. Columns, mean of three independent experiments done in triplicate; bars, SE. *, P < 0.01, compared with serum-starved conditions at respective treatment time interval. C to E, both HepG2 and Huh7 cells were grown to 80% confluence, serum-starved for 16 h, and incubated in the presence of 100 ng/mL leptin for 6 and 24 h. Cell lysates were prepared and normalized for protein content; 100 µg of protein was resolved on 10% SDS-PAGE followed by immunoblot analysis with antibodies for cyclin D1 (C), p21 (D), and KLF5 (E). The Western blot signals were quantified by densitometry and normalized to β-actin. Representative of multiple independent experiments. *, P < 0.05, compared with untreated controls.
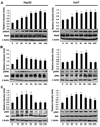
Figure 3. Leptin stimulates the phosphorylation of STAT3, ERK, and AKT
HepG2 and Huh7 cells were cultured, serum-starved for 16 h, and treated with leptin (100 ng/mL) for various time intervals. Time 0 represents the absence of leptin or untreated cells. Cell lysates were prepared and quantified for protein content. A total of 100 µg protein was resolved on 10% SDS-PAGE followed by immunoblot analysis with specific antibodies against total or phosphorylated forms of STAT3 (A), ERK (B), and AKT (C). The representative histogram is the densitometric analysis of bands showing fold increase in levels of phosphorylated forms of STAT3, ERK, and AKT with respect to total STAT3, ERK, and AKT protein, at various intervals of leptin treatment. Representative of multiple independent experiments with a representative immunoblot for pSTAT3, STAT3, pERK, ERK, pAKT, and AKT. Columns, mean densitometric values of band intensities; bars, SE. *, P < 0.05, compared with untreated control cells. Immunoblot for β-actin was done as a loading control.
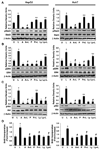
Figure 4. Leptin fails to stimulate proliferation of hepatocellular carcinoma cells in the presence of inhibitors of JAK/STAT, ERK, or AKT
A to C, HepG2 and Huh7 cells were cultured, serum-starved for 16 h, and treated with leptin (100 ng/mL; L). For combined treatment, cells were pretreated with 100 µmol/L AG490 (A or A + L), 10 µmol/L PD98059 (P or P + L), or 10 µmol/L LY294002 (Ly or Ly + L) for 45 min followed by leptin treatment. Untreated controls (U). Cell lysates were prepared and quantified for protein content. A total of 100 µg protein was resolved on 10% SDS-PAGE followed by immunoblot analysis with specific antibodies against total or phosphorylated forms of STAT3 (A), ERK (B), and AKT (C). The representative histogram is the densitometric analysis of bands showing fold increase in levels of phosphorylated forms with respect to total protein. *, P < 0.01, compared with untreated control cells; #, P < 0.01, compared with leptin treatment; **, P < 0.05, leptin with inhibitor compared with respective inhibitor treatment alone. D, cells were treated as described earlier, and BrdUrd incorporation analysis was done as described in Materials and Methods. Columns, mean of experiments done in triplicates thrice; bars, SE. *, P < 0.001, compared with untreated control cells; #, P < 0.005, compared with leptin treatment. Immunoblot for β-actin was done as a loading control.
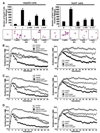
Figure 5. Leptin induces invasion potential of hepatocellular carcinoma cells
A, HepG2 and Huh7 cells were cultured in Matrigel invasion chambers in serum-free media containing 100 ng/mL leptin (L) for 24 h. For combined treatment, cells were pretreated with 100 µmol/L AG490 (L + AG), 10 µmol/L PD98059 (L + PD), or 10 µmol/L LY294002 (L + LY) for 45 min followed by leptin treatment. Untreated controls (U). The number of cells that invaded through the Matrigel was counted. Columns, mean of Matrigel invasion assay done in triplicate twice; bars, SE. *, P < 0.01, compared with untreated control cells; #, P < 0.01, compared with leptin treatment. H&E staining showing the invasion of HepG2 and Huh7 cells in a Matrigel invasion assay. B to D, resistance changes in the impedance at 4 kHz as confluent layers of HUVECs were challenged with HepG2 and Huh7 cell suspensions. The control curve of HUVEC cells received media without HepG2 or Huh7 cells. HepG2 and Huh7 cells were treated with 100 µmol/L AG490 and 100 ng/mL leptin (AG + Leptin; B) or 10 µmol/L PD98059 and 100 ng/mL leptin (PD + Leptin; C) or 10 µmol/L LY294002 along with 100 ng/mL leptin (LY + Leptin; D). Changes in resistance were monitored for 24 h. All the experiments were done thrice in triplicates.
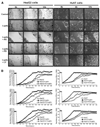
Figure 6. Leptin up-regulates the migration of hepatocellular carcinoma cells
A, both HepG2 and Huh7 cells were grown to confluence on fibronectin-coated surface, serum-starved for 16 h, and scratched with a pipette tip. The plates were photographed immediately following scratching. Culture media were replaced with control media (media containing 100 ng/mL leptin). For combined treatment, cells were pretreated with 100 µmol/L AG490 (Leptin + AG), 10 µmol/L PD98059 (Leptin + PD), or 10 µmol/L LY294002 (Leptin + LY) along with leptin treatment. The plates were photographed at the identical location of the initial image at 6 and 12 h. B, confluent HepG2 and Huh7 cells, seeded in ECIS plates and treated with leptin (100 ng/mL) alone or along with 100 µmol/L AG490 (AG + Leptin) or 10 µmol/L PD98059 (PD + Leptin) or 10 µmol/L LY294002 (LY + Leptin), were subjected to an elevated voltage pulse of 40-kHz frequency at 3.5-V amplitude for 30 s. The wound was then allowed to heal from cells surrounding the small active electrode that did not undergo the elevated voltage pulse. Resistance was measured before and after the elevated voltage pulse application as described in Materials and Methods. The measurements were stopped 24 h after wound healing. All the experiments were done thrice in triplicates.
Similar articles
- Leptin promotes the proliferative response and invasiveness in human endometrial cancer cells by activating multiple signal-transduction pathways.
Sharma D, Saxena NK, Vertino PM, Anania FA. Sharma D, et al. Endocr Relat Cancer. 2006 Jun;13(2):629-40. doi: 10.1677/erc.1.01169. Endocr Relat Cancer. 2006. PMID: 16728588 Free PMC article. - Leptin enhances migration of human papillary thyroid cancer cells through the PI3K/AKT and MEK/ERK signaling pathways.
Cheng SP, Yin PH, Hsu YC, Chang YC, Huang SY, Lee JJ, Chi CW. Cheng SP, et al. Oncol Rep. 2011 Nov;26(5):1265-71. doi: 10.3892/or.2011.1388. Epub 2011 Jul 12. Oncol Rep. 2011. PMID: 21750869 - Leptin induces functional activation of cyclooxygenase-2 through JAK2/STAT3, MAPK/ERK, and PI3K/AKT pathways in human endometrial cancer cells.
Gao J, Tian J, Lv Y, Shi F, Kong F, Shi H, Zhao L. Gao J, et al. Cancer Sci. 2009 Mar;100(3):389-95. doi: 10.1111/j.1349-7006.2008.01053.x. Epub 2008 Dec 16. Cancer Sci. 2009. PMID: 19154413 Free PMC article. - Exploring the JAK/STAT Signaling Pathway in Hepatocellular Carcinoma: Unraveling Signaling Complexity and Therapeutic Implications.
Park H, Lee S, Lee J, Moon H, Ro SW. Park H, et al. Int J Mol Sci. 2023 Sep 6;24(18):13764. doi: 10.3390/ijms241813764. Int J Mol Sci. 2023. PMID: 37762066 Free PMC article. Review. - JAK/STAT signaling and cellular iron metabolism in hepatocellular carcinoma: therapeutic implications.
Rah B, Farhat NM, Hamad M, Muhammad JS. Rah B, et al. Clin Exp Med. 2023 Nov;23(7):3147-3157. doi: 10.1007/s10238-023-01047-8. Epub 2023 Mar 28. Clin Exp Med. 2023. PMID: 36976378 Review.
Cited by
- CircRNA VIM silence synergizes with sevoflurane to inhibit immune escape and multiple oncogenic activities of esophageal cancer by simultaneously regulating miR-124/PD-L1 axis.
Gao C, Xu YJ, Qi L, Bao YF, Zhang L, Zheng L. Gao C, et al. Cell Biol Toxicol. 2022 Oct;38(5):825-845. doi: 10.1007/s10565-021-09613-0. Epub 2021 May 20. Cell Biol Toxicol. 2022. PMID: 34018092 - Leptin and leptin receptor expression in breast cancer.
Kim HS. Kim HS. Cancer Res Treat. 2009 Sep;41(3):155-63. doi: 10.4143/crt.2009.41.3.155. Epub 2009 Sep 28. Cancer Res Treat. 2009. PMID: 19809565 Free PMC article. - Leptin rs7799039 (G2548A) polymorphism is associated with cancer risk: a meta-analysis involving 25,799 subjects.
Tang W, Kang M, Liu C, Qiu H. Tang W, et al. Onco Targets Ther. 2019 Apr 16;12:2879-2890. doi: 10.2147/OTT.S190093. eCollection 2019. Onco Targets Ther. 2019. PMID: 31114233 Free PMC article. - Glioblastoma-derived leptin induces tube formation and growth of endothelial cells: comparison with VEGF effects.
Ferla R, Bonomi M, Otvos L Jr, Surmacz E. Ferla R, et al. BMC Cancer. 2011 Jul 19;11:303. doi: 10.1186/1471-2407-11-303. BMC Cancer. 2011. PMID: 21771332 Free PMC article. - Current approach in the treatment of hepatocellular carcinoma.
Rossi L, Zoratto F, Papa A, Iodice F, Minozzi M, Frati L, Tomao S. Rossi L, et al. World J Gastrointest Oncol. 2010 Sep 15;2(9):348-59. doi: 10.4251/wjgo.v2.i9.348. World J Gastrointest Oncol. 2010. PMID: 21160806 Free PMC article.
References
- Abu-Abid S, Szold A, Klausner J. Obesity and cancer. J Med. 2002;33:73–86. - PubMed
- Calle EE, Rodriquez C, Walker-Thurmond K, Thun MJ. Overweight, obesity, and mortality from cancer in a prospectively studied cohort of U.S. adults. N Engl J Med. 2003;348:1625–1638. - PubMed
- Matsuzawa Y, Funahashi T, Nakamura T. Molecular mechanism of metabolic syndrome X: contribution of adipocytokines adipocyte-derived bioactive substances. Ann N Y Acad Sci. 1999;892:146–154. - PubMed
- Rose DP, Komninou D, Stephenson GD. Obesity, adipocytokines, and insulin resistance in breast cancer. Obes Rev. 2004;5:153–165. - PubMed
Publication types
MeSH terms
Substances
Grants and funding
- DK062092/DK/NIDDK NIH HHS/United States
- R01 DK061941-02/DK/NIDDK NIH HHS/United States
- R56 DK062092/DK/NIDDK NIH HHS/United States
- R01 DK062092-02/DK/NIDDK NIH HHS/United States
- R56 DK061941/DK/NIDDK NIH HHS/United States
- R01 DK071594/DK/NIDDK NIH HHS/United States
- DK061941/DK/NIDDK NIH HHS/United States
- R24 DK064399/DK/NIDDK NIH HHS/United States
- DK071594/DK/NIDDK NIH HHS/United States
- R24 DK064399-01/DK/NIDDK NIH HHS/United States
- R01 DK062092/DK/NIDDK NIH HHS/United States
- R01 DK061941/DK/NIDDK NIH HHS/United States
- R24DK064399/DK/NIDDK NIH HHS/United States
LinkOut - more resources
Full Text Sources
Other Literature Sources
Medical
Miscellaneous
