Novel roles for APC family members and Wingless/Wnt signaling during Drosophila brain development - PubMed (original) (raw)
Comparative Study
Novel roles for APC family members and Wingless/Wnt signaling during Drosophila brain development
Melissa A Hayden et al. Dev Biol. 2007.
Abstract
Construction of the brain is one of the most complex developmental challenges. Wnt signals shape all tissues, including the brain, and the tumor suppressor adenomatous polyposis coli (APC) is a key negative regulator of Wnt/Wingless (Wg) signaling. We carried out the first assessment of the role of APC proteins in brain development, simultaneously inactivating both APC1 and APC2 in clones of cells in the Drosophila larval optic lobe. We focused on the medulla, where epithelial neural progenitors shift from symmetric to asymmetric divisions across the lateral-medial axis. Loss of both APCs triggers dramatic defects in optic lobe development. Double mutant cells segregate from wild-type neighbors, while double mutant neurons form tangled axonal knots, suggesting changes in cell adhesion. Strikingly, phenotypes are graded along the anterior-posterior axis. Activation of Wg signaling downstream of APC mimics these phenotypes, a dominant-negative TCF blocks them, and a known Wg target, decapentaplegic, is activated in double mutant clones, strongly suggesting that the phenotypes result from activated Wg signaling. We also explored the roles of classic cadherins in differential adhesion. Finally, we propose a model suggesting that Wg signaling regulates fine scale cell fates along the anterior-posterior axis, in part by creating an adhesion gradient and consider possible alternate explanations for our observations.
Figures
Fig. 1
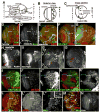
Development of the medulla. A–C. Diagrams , 3rd instar larval brain. A. Entire brain. B. Anterior surface view of single optic lobe (as in D). C. Cross section of optic lobe in B (as in H). D–N, Wild-type late 3rd instar larval brain lobes, dorsal to top, antigens indicated. D–G, J–M. Anterior (D,F,G,J,L) or posterior (E,K,M) surface views. Blue brackets, epithelial neuroblasts; white brackets, medial neuroblasts. H. Cross-section through medulla (as in B). Arrowhead, fasciculated bundles of medullar axons projecting to medullar neuropil (arrow). I1–I3. Section series, from below anterior surface to just below posterior surface. D’,I2, L=lamina, m=Medulla. Green and yellow arrowheads, dorsal and ventral horns of neuropil, respectively. I2,I3. Red arrowheads=fasciculated medullar neurons. M, arrow=Mira-positive cells in IPC. N. Anterior, just below surface. Arm levels are higher in dorsal neuronal cell bodies (arrow). Scale bar=30μm.
Fig. 2
Larval development of the optic lobe. A. Late 1st/early 2nd instar. Arrows=epithelial optic lobe progenitors. B1–B3. 2nd instar. Section series, posterior surface (B1) to anterior surface (B3). One horn of the IPC reaches the posterior surface (B1), while the OPC is prominent on the anterior surface (B3). C. Early 3rd instar. Blue bracket, all neuroblasts are epithelial and express high levels of DE-cad. Scale bar=30μm.
Fig. 3
Proliferation pattern and cell sorting of wild-type medullar cells. GFP-marked clones of wild-type cells. 3rd instar brain lobes, dorsal to top. A1–A4. Serial sections, clone on the anterior side of the medulla. A2, arrow=roughly wedge-shaped clone. A3, Fasciculated medullar neurons (arrow) projecting to the medullar neuropil (arrowhead). B1–B2. Clone arising on the medial edge of the medullar neuroblasts (B1, arrow), which forms a wedge-shaped clone of neurons (B2, arrow). C1–C2,D1–D2. Surface and deeper sections of clones on the ventral horn of the posterior medulla. Note complex shapes (arrows) due to free sorting with wild-type cells, and normal neuronal projections. E1–E3. Serial sections, intermediate region clone (bottom right, E2 arrow) and an “edge clone” on the dorsal horn of the posterior medulla (E2,arrowhead). E3,arrow=normal neurons from intermediate region clone. Scale bar=30μm.
Fig. 4
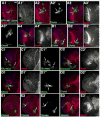
Reduction in APC function leads to epithelial segregation and defects in axon outgrowth. GFP-marked APC2d40 APC1Q8 double mutant clones in 3rd instar brain lobes, dorsal up (H,I=wild-type). Antigens indicated. A,B,D–F. Anterior views of medulla. Numbered panels are confocal sections from anterior surface successively deeper. A,B,E. Epithelial loops. C, left. Diagram of epithelial loops. D2,F2. Axon knots. C, right. Diagram of axon knot. G. Epithelial ball (arrow) beneath surface and escaper axons (arrowhead). H–J. BP102 accumulates in wild-type (H,I) axons (arrowheads) and medullar neuropil (arrows), and in mutant axon knots (J, arrow). K. Hyperfasciculated axons (arrow). L. Escaper axons (arrowhead). Scale bar=30μm.
Fig. 5
Loss of APC function has differential effects along the anterior-posterior axis. A. Diagram of medulla showing regions with strong phenotypes (red), milder phenotypes (yellow) or only mild effects on cell sorting (green). B–M. GFP-marked APC2g10 APC1Q8 double mutant clones in 3rd instar brain lobes, dorsal up (I–K are wild-type). Antigens and clone position in degrees indicated. Numbered panels are confocal sections from anterior surface successively deeper. B,C. Epithelial loops and knots. D,E. Clones with hyperfasciculated axons (arrows). F–H,L. Posterior clones exhibiting round shape but normal in morphology. Note increased Arm accumulation in L (arrow). I–K. Comparable wild-type clones. M. Epithelial loop. Mira is absent in lateral epithelial region (arrow) and present in medial cells of clone (arrowhead). Scale bar=30μm.
Fig. 6
Clones lacking APC function are larger than wild-type clones. A. Volumes of position-matched wild-type and APC2g10 APC1Q8 double mutant clones, with means and SD. B–J. 3rd instar brain lobes, dorsal up. Antigens indicated. B–E,H–J. GFP-marked APC2g10 APC1Q8 double mutant clones, outlined in yellow. F,G are wild-type. B–E. Phospho-histoneH3, showing mitosis. B–D. Anterior clones. E. Posterior clone. In wild-type, at any given time a fraction of the neuroblasts in the superficial layers of the medulla are mitotic, as assessed by P-His (B,C arrows), with slightly lower levels in epithelial neuroblasts adjacent to the laminar furrow. In deeper sections through medullar neurons, few cells are mitotic (E2, arrow), as expected. Since double null mutant cells form loops and knots, cells are often displaced from their normal positions; at times this leads to apparent reductions or increases in P-His, but double mutant cells generally matched comparable wild-type cells (compare arrowheads in B–E). F–J, CycE expression in wild-type brain (F,G) and anterior double mutant clones (H–J). Scale bar=30μm.
Fig. 7
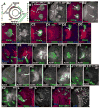
Activation of Wg signaling is necessary and sufficient for formation of epithelial knots and loops. 3rd instar brain lobes, dorsal up. Antigens indicated. A–E. GFP-marked MARCM clones expressing myc-tagged ArmS10. A. Anterior clone expressing high levels of ArmS10. B. Intermediate-region clone expressing high levels of ArmS10. C. Anterior clone expressing low levels of ArmS10. D. Posterior clone expressing high levels of ArmS10. E. Posterior clone expressing moderate levels of ArmS10. F, G. GFP-marked APC2g10 APC1Q8 double mutant clones—50% should also express TCF-DN. F. Anterior clone with very mild axon knot phenotype. G. Anterior clone with a wild-type morphology. Scale bar=30μm.
Fig. 8
The Wg target gene dpp is activated in clones lacking APC function. Antigens indicated. A. Diagram showing wild-type Wg and Dpp expression domains. B–F. 3rd instar brain lobes, dorsal up. B. Wild-type, _dpp-_lacZ expression pattern. C–H. GFP-marked APC2g10 APC1Q8 double mutant clones. Arrows indicate mutant clones with ectopic _dpp-_lacZ expression. C. Anterior clones. D. Intermediate-region clone. E. Posterior clone (arrows and arrowheads are for comparison with wild-type pattern in B). F. Posterior clone in the tip of the medullar horns (the putative Wg-expression domain). G,H. Early 3rd instars. Scale bar=30μm.
Fig. 9
Loss of DE-cad function can cause axon knots, but DE-cad overexpression does not. 3rd instar brain lobes, dorsal up. Antigens indicated. A–C. GFP-marked shgR69 mutant clones (arrows). A. Anterior clone forming axon knot. B. Intermediate region clone forming axon knot (inset, actin alone). C. Posterior clone with rounded margin but no axon defects. D. Wild-type posterior control clone. E–F. GFP-marked MARCM clones overexpressing DE-cad (arrows). In each case several sections from surface inward are shown. E inset=close-up or region marked with arrow). Scale bar=30μm.
Similar articles
- Drosophila APC2 and APC1 have overlapping roles in the larval brain despite their distinct intracellular localizations.
Akong K, McCartney BM, Peifer M. Akong K, et al. Dev Biol. 2002 Oct 1;250(1):71-90. doi: 10.1006/dbio.2002.0777. Dev Biol. 2002. PMID: 12297097 - Fat and Wingless signaling oppositely regulate epithelial cell-cell adhesion and distal wing development in Drosophila.
Jaiswal M, Agrawal N, Sinha P. Jaiswal M, et al. Development. 2006 Mar;133(5):925-35. doi: 10.1242/dev.02243. Epub 2006 Feb 1. Development. 2006. PMID: 16452097 - Testing hypotheses for the functions of APC family proteins using null and truncation alleles in Drosophila.
McCartney BM, Price MH, Webb RL, Hayden MA, Holot LM, Zhou M, Bejsovec A, Peifer M. McCartney BM, et al. Development. 2006 Jun;133(12):2407-18. doi: 10.1242/dev.02398. Development. 2006. PMID: 16720878 - The Yin-Yang of TCF/beta-catenin signaling.
Barker N, Morin PJ, Clevers H. Barker N, et al. Adv Cancer Res. 2000;77:1-24. doi: 10.1016/s0065-230x(08)60783-6. Adv Cancer Res. 2000. PMID: 10549354 Review. - Wnt/Wingless signaling in Drosophila.
Swarup S, Verheyen EM. Swarup S, et al. Cold Spring Harb Perspect Biol. 2012 Jun 1;4(6):a007930. doi: 10.1101/cshperspect.a007930. Cold Spring Harb Perspect Biol. 2012. PMID: 22535229 Free PMC article. Review.
Cited by
- Impact of molecular biology studies on the understanding of brain tumors in childhood.
Nageswara Rao AA, Packer RJ. Nageswara Rao AA, et al. Curr Oncol Rep. 2012 Apr;14(2):206-12. doi: 10.1007/s11912-012-0214-3. Curr Oncol Rep. 2012. PMID: 22237928 - Yan, an ETS-domain transcription factor, negatively modulates the Wingless pathway in the Drosophila eye.
Olson ER, Pancratov R, Chatterjee SS, Changkakoty B, Pervaiz Z, DasGupta R. Olson ER, et al. EMBO Rep. 2011 Sep 30;12(10):1047-54. doi: 10.1038/embor.2011.159. EMBO Rep. 2011. PMID: 21869817 Free PMC article. - Retinal determination genes coordinate neuroepithelial specification and neurogenesis modes in the Drosophila optic lobe.
Apitz H, Salecker I. Apitz H, et al. Development. 2016 Jul 1;143(13):2431-42. doi: 10.1242/dev.135004. Development. 2016. PMID: 27381228 Free PMC article. - Drosophila clueless is highly expressed in larval neuroblasts, affects mitochondrial localization and suppresses mitochondrial oxidative damage.
Sen A, Damm VT, Cox RT. Sen A, et al. PLoS One. 2013;8(1):e54283. doi: 10.1371/journal.pone.0054283. Epub 2013 Jan 16. PLoS One. 2013. PMID: 23342118 Free PMC article. - Evidence for tissue-specific Jak/STAT target genes in Drosophila optic lobe development.
Wang H, Chen X, He T, Zhou Y, Luo H. Wang H, et al. Genetics. 2013 Dec;195(4):1291-306. doi: 10.1534/genetics.113.155945. Epub 2013 Sep 27. Genetics. 2013. PMID: 24077308 Free PMC article.
References
- Ahmed Y, Hayashi S, Levine A, Wieschaus E. Regulation of Armadillo by a Drosophila APC Inhibits Neuronal Apoptosis during Retinal Development. Cell. 1998;93:1171–1182. - PubMed
- Ahmed Y, Nouri A, Wieschaus E. Drosophila Apc1 and Apc2 regulate Wingless transduction throughout development. Development. 2002;129:1751–62. - PubMed
- Akong K, Grevengoed E, Price M, McCartney B, Hayden M, DeNofrio J, Peifer M. Drosophila APC2 and APC1 Play Overlapping Roles in Wingless Signaling in the Embryo and Imaginal Discs. Dev, Biol. 2002a;250:91–100. - PubMed
- Akong K, McCartney B, Peifer M. Drosophila APC2 and APC1 Have Overlapping Roles in the Larval Brain Despite Their Distinct Intracellular Localizations. Dev Biol. 2002b;250:71–90. - PubMed
- Alonso L, Fuchs E. Stem cells in the skin: waste not, Wnt not. Genes Dev. 2003;17:1189–200. - PubMed
Publication types
MeSH terms
Substances
Grants and funding
- R01 GM067236/GM/NIGMS NIH HHS/United States
- T32 GM007092/GM/NIGMS NIH HHS/United States
- 5T32GM07092/GM/NIGMS NIH HHS/United States
- R01GM67236/GM/NIGMS NIH HHS/United States
LinkOut - more resources
Full Text Sources
Molecular Biology Databases
Miscellaneous


