Essential role of PDK1 in regulating endothelial cell migration - PubMed (original) (raw)
Essential role of PDK1 in regulating endothelial cell migration
Luca Primo et al. J Cell Biol. 2007.
Abstract
The serine/threonine protein kinase phosphoinositide-dependent kinase 1 (PDK1) plays a central role in cellular signaling by phosphorylating members of the AGC family of kinases, including PKB/Akt. We now present evidence showing that PDK1 is essential for the motility of vascular endothelial cells (ECs) and that it is involved in the regulation of their chemotaxis. ECs differentiated from mouse embryonic stem cells lacking PDK1 completely lost their ability to migrate in vitro in response to vascular endothelial growth factor-A (VEGF-A). In addition, PDK1(-/-) embryoid bodies exhibit evident developmental and vascular defects that can be attributed to a reduced cell migration. Moreover, the overexpression of PDK1 increased the EC migration induced by VEGF-A. We propose a model of spatial distribution of PDK1 and Akt in which the synthesis of phosphatidylinositol 3,4,5 triphosphate at plasma membrane by activation of phosphoinositide 3-kinase recruits both proteins at the leading edge of the polarized ECs and promotes cell chemotaxis. These findings establish a mechanism for the spatial localization of PDK1 and its substrate Akt to regulate directional migration.
Figures
Figure 1.
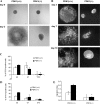
Knock-out of PDK1 affects early vascular development in EBs and EB-derived EC migration. (A) Representative phase-contrast images of EBs derived from PDK1+/+ and PDK1−/− ES cells at day 0 and 3 of differentiation. (B) EBs PDK1+/+ and PDK1−/− at 3, 7, and 10 d of differentiation were fixed and analyzed by indirect immunofluorescence with rat α-CD31 antibody; antigen–antibody complexes were detected with Cy2-conjugated donkey α-rat IgG. (C and D) FACS analysis of cells derived from EB PDK1+/+ and PDK1−/− at different differentiation stage (3, 7, and 10 d) to evaluate percentage of CD31- and Flk1-positive cells, respectively; data were plotted as the mean ± the SD of the percentage of positive cells from three independent experiments. (E) ES cells PDK1+/+ and PDK1−/− were differentiated into EBs for 3 d; they were then disaggregated, and cells were used in a chemotaxis assay, in the presence of a gradient of fibronectin (20 μg/ml) in combination (black bars) or not (white bars) with 30 ng/ml VEGF-A. Migration index is calculated assigning a value of 1 to the number of PDK1+/+ CD31-positive cells that migrated toward fibronectin; data were plotted as the mean ± the SD of five independent experiments. Statistical significance (*, P < 0.01) is shown for VEGF-A–stimulated EC-PDK−/− compared with EC-PDK1+/+. Images are representative of five independent experiments. Bars, 100 μm.
Figure 2.
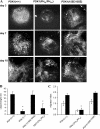
The PH domain of PDK1 is essential for vessel formation in EBs and for EB-derived EC migration. (A) EB PDK1+/+, PDK1PHKI/PHKI, and PDK1155E/155E at 3, 7, and 10 d of differentiation were fixed and analyzed by indirect immunofluorescence with rat α-CD31 antibody; antigen–antibody complexes were detected with Cy2-conjugated donkey α-rat IgG. Images are representative of five independent experiments. Bar, 100 μm. (B) 10 EB PDK1+/+, PDK1−/−, PDK1PHKI/PHKI, and PDK1155E/155E at 7 d of differentiation from 5 different experiments were analyzed with imaging software to measure the total length of vessel-like structures. Data were plotted as the mean ± the SD. Statistical significance (*, P < 0.01) is shown for PDK−/− and PDK1PHKI/PHKI EBs compared with PDK1+/+ EBs. (C) ES cells PDK1+/+, PDK1PHKI/PHKI and PDK1155E/155E were differentiated into EBs for 3 d; they were then disaggregated, and cells were used in a chemotaxis assay, in the presence of a gradient of 20 μg/ml fibronectin in combination with 30 ng/ml VEGF-A (black bars) or not (white bars). Migration index is calculated assigning a value of 1 to the number of PDK1+/+ CD31-positive cells that migrated toward fibronectin; data were plotted as the mean ± the SD of five independent experiments; statistical significance (*, P < 0.01) is shown for VEGF-A–stimulated EC-PDK1PHKI/PHKI compared with EC-PDK1+/+.
Figure 3.
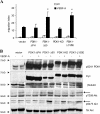
Overexpression of PDK1 enhances VEGF-induced EC migration. (A) ECs infected with retroviruses carrying wild-type PDK1 (PDK1), membrane-targeted PDK1 (PDK1caax), and not carrying anything (vector) were used in chemotaxis assays in the presence of 10 ng/ml VEGF-A, added in the lower compartment of the chamber (medium/VEGF-A) or in both the upper and lower ones (VEGF-A/VEGF-A). Migration index is calculated assigning a value of 1 to the number of vector cells migrated in absence of stimulus; data were plotted as the mean ± the SD of six independent experiments. Statistical significance (*, P < 0.01) is shown for VEGF-A–stimulated EC-PDK1 and PDK1caax compared with vector ECs. (B) ECs infected with the indicated retroviruses were plated on gelatin, with or without 100 ng/ml VEGF-A. Time-lapse videomicroscopy was performed, and images were recorded every 10 min for 6 h. Velocity values shown are means of 60 cells from three different experiments. Data were plotted as the mean ± the SD. (C and D) Cells were serum deprived for 2 h, and then stimulated or not stimulated with VEGF-A for 10 min; 50 μg of each lysate was immunoblotted with the indicated antibody. Western blots shown are representative of five experiments performed with similar results.
Figure 4.
The promigratory effect of PDK1 requires its PH domain and its catalytic activity. (A) ECs were infected with retroviruses carrying PDK1 with a deleted PH domain (ΔPH), PDK1 with of the first 50 amino acids deleted (Δ50), PDK1 kinase-dead (KD), PDK1 mutated in the PIF pocket (L155E), and retroviruses not carrying anything (vector); these cells were used in chemotaxis assays in presence of a gradient of VEGF-A (10 ng/ml). Migration index is calculated assigning a value of 1 to the number of vector cells migrated in the absence of stimulus; data were plotted as the mean ± the SD of six independent experiments. Statistical significance (*, P < 0.01) is shown for VEGF-A–stimulated EC-PDK1-Δ50 and PDK1-L155E compared with vector ECs. (B) Cells were serum deprived for 2 h, and then stimulated or not stimulated with VEGF-A for 10 min; 50 μg of each lysate was immunoblotted with the indicated antibody. Western blots shown are representative of five experiments performed with similar results.
Figure 5.
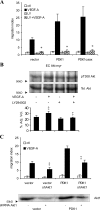
The promigratory effect of PDK1 is PI3K-dependent and requires Akt. (A) ECs infected with retroviruses carrying wild-type PDK1, membrane-targeted PDK1, and not carrying anything (vector) were used in chemotaxis assays in the presence of 10 ng/ml VEGF-A; 50 μM of the PI3K inhibitor LY294002 was added to the lower chamber, in combination or not with VEGF-A, and to the cells in the upper chamber. Migration index is calculated assigning a value of 1 to the number of vector cells migrated in the absence of stimulus; data were plotted as the mean ± the SD of six independent experiments; statistical significance (*, P < 0.01) is shown for LY294002-treated+ VEGF-A–stimulated cells compared with VEGF-A–stimulated cells. (B) EC-Akt-myr were serum deprived for 2 h, pretreated or not with 50 μm LY294002 for 45 min, and then stimulated or not with 30 ng/ml VEGF-A for 10 min; cells were lysed, and overexpressed Akt-myr was immunoprecipitated with α-HA antibody; immunocomplexes were separated by SDS-PAGE and immunoblotted with indicated antibody. Three independent experiments were acquired with the molecular imager ChemiDoc XRS, and densitometric analysis was performed with Quantity One software. Data were plotted as the mean ± the SD of the percentage of adjusted volume. Statistical significance is shown for VEGF-A–stimulated cells compared with control (‡, P < 0.05) and for LY294002-treated+ VEGF-A–stimulated cells compared with VEGF-A-stimulated (‡, P < 0.05). Western blot shown is representative of three experiments performed with similar results. (C) Vector ECs and EC-PDK1 were infected with lentiviruses carrying shRNA for Akt1 or with vector; after 72 h, the cells were used in chemotaxis assays in the presence of a gradient of VEGF-A (10 ng/ml). Migration index is calculated assigning a value of 1 to the number of vector cells migrated in absence of stimulus; data were plotted as mean ± SD of three independent experiments. Statistical significance (‡, P < 0.05) is shown for VEGF-A–stimulated shAkt1 ECs compared with respective controls. 50 μg of lysate of each cell type was immunoblotted with α-Akt1 mAb. Western blot shown is representative of three experiments performed with similar results.
Figure 6.
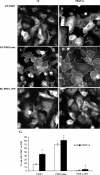
PDK1 translocates to the membrane after VEGF-A stimulation. ECs infected with the indicated retroviruses were seeded on gelatin-coated glass coverslips; they were then serum deprived and stimulated (B, D, and F) or not (A, C, and E) with 50 ng/ml VEGF-A. Cells were then fixed and analyzed by indirect immunofluorescence with mAb α-PDK1 (A–D) or mAb α-myc (E and F); antigen–antibody complexes were detected with Alexa Fluor 488–conjugated donkey α-mouse IgG. Bar, 10 μm. Images shown are representative of >50% of observed cells. (G) A total of 200 cells from three independent experiments were analyzed to calculate the percentage of cells showing PDK1 staining on plasma membrane. Data were plotted as the mean ± the SD. Statistical significance is shown for VEGF-A–stimulated EC-PDK1 compared with control cells (*, P < 0.05) and VEGF-A–stimulated EC-PDK1caax and PDK1-ΔPH compared with VEGF-A–stimulated EC-PDK1 (‡, P < 0.05).
Figure 7.
PDK1 localizes at the leading edge of migrating ECs in a PH domain–dependent way and colocalizes with pT308Akt in migrating MEFs. (A–C) ECs infected with indicated retroviruses were seeded at high density on gelatin-coated glass coverslips; monolayer cells were wounded by dragging a plastic pipette tip across the cell surface; and 50 ng/ml VEGF-A was added to the medium. After 6 h, cells were fixed and analyzed by indirect immunofluorescence with mAb α-PDK1 (A and C) or mAb α-myc (B); antigen–antibody complexes were detected with Alexa Fluor 488–conjugated donkey α-mouse IgG. (D–F) MEFs transiently transfected with PDK1 were seeded at high density on gelatin-coated glass coverslips; monolayer cells were wounded by dragging a plastic pipette tip across the cell surface; and medium supplemented with 50 ng/ml PDGF was added. After 6 h, cells were fixed and double stained with mAb α-PDK1 (green) and rabbit α-pT308Akt (red); antigen-antibody complexes were detected with Alexa Fluor 488–conjugated donkey α-mouse IgG and Alexa Fluor 555–conjugated donkey α-rabbit. Images shown are representative of >50% of observed cells. Boxed regions are enlargements of the cell's leading edge. Bars, 10 μm.
Figure 8.
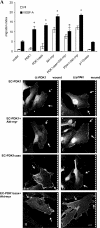
Spatial distribution of PDK1 and Akt regulates chemotaxis. (A) ECs transduced with retroviruses carrying membrane-targeted forms of PDK1 (PDK1caax), Akt (Akt-myr), PI3K-catalytic subunit p110 (p110caax), both PDK1caax and Akt-myr, both PDK1 and Akt-myr, and vector were used in chemotaxis assays in the presence of a gradient of VEGF-A (10 ng/ml). Migration index is calculated assigning a value of 1 to the number of vector cells migrated in the absence of stimulus. Data were plotted as the mean ± the SD of three independent experiments. Statistical significance is shown for VEGF-A–stimulated EC-PDK1, PDK1caax, Akt-myr, PDK1+Akt-myr (*, P < 0.05) compared with EC-vector and for VEGF-A–stimulated PDK1caax+Akt-myr (‡, P < 0.05) compared with EC-PDK1+ Akt-myr. (B–I) ECs infected with indicated retroviruses were seeded at high density on gelatin-coated glass coverslips; monolayer cells were wounded by dragging a plastic pipette tip across the cell surface; and 50 ng/ml VEGF-A was added to the medium. After 6 h, cells were fixed and analyzed by indirect immunofluorescence with mAb α-PDK1 (B, D, F, and H) or rabbit α-pT308Akt (C, E, G, and I); antigen–antibody complexes were detected with Alexa Fluor 405–conjugated donkey α-mouse or α-rabbit IgG. Images shown are representative of >50% of observed cells. Bars,10 μm.
Figure 9.
Proposed model of PDK1 action on directional cell migration. Stimulation of wild-type ECs with VEGF-A induces the local activation of PI3K and the formation of a gradient of PtdIns(3,4,5)P3 (indicated with green) from the front to the rear of the cell that allows the polarized localization of PDK1 and Akt on the leading edge and directional migration; overexpression of membrane-anchored PDK1 strongly increases local level of Akt activation and, consequently, chemotaxis; in contrast, when ECs overexpress both PDK1caax and Akt-myr, activation of Akt is uniformly distributed along the membrane and ECs migrate less efficiently. The arrow sizes are indicative of the migration index.
Similar articles
- Chemotactic activation of Dictyostelium AGC-family kinases AKT and PKBR1 requires separate but coordinated functions of PDK1 and TORC2.
Liao XH, Buggey J, Kimmel AR. Liao XH, et al. J Cell Sci. 2010 Mar 15;123(Pt 6):983-92. doi: 10.1242/jcs.064022. J Cell Sci. 2010. PMID: 20200230 Free PMC article. - Down-regulation of 3-phosphoinositide-dependent protein kinase-1 levels inhibits migration and experimental metastasis of human breast cancer cells.
Liu Y, Wang J, Wu M, Wan W, Sun R, Yang D, Sun X, Ma D, Ying G, Zhang N. Liu Y, et al. Mol Cancer Res. 2009 Jun;7(6):944-54. doi: 10.1158/1541-7786.MCR-08-0368. Epub 2009 Jun 16. Mol Cancer Res. 2009. PMID: 19531564 - Puromycin-insensitive leucyl-specific aminopeptidase (PILSAP) binds and catalyzes PDK1, allowing VEGF-stimulated activation of S6K for endothelial cell proliferation and angiogenesis.
Yamazaki T, Akada T, Niizeki O, Suzuki T, Miyashita H, Sato Y. Yamazaki T, et al. Blood. 2004 Oct 15;104(8):2345-52. doi: 10.1182/blood-2003-12-4260. Epub 2004 Jun 8. Blood. 2004. PMID: 15187024 - The PI3K-PDK1 connection: more than just a road to PKB.
Vanhaesebroeck B, Alessi DR. Vanhaesebroeck B, et al. Biochem J. 2000 Mar 15;346 Pt 3(Pt 3):561-76. Biochem J. 2000. PMID: 10698680 Free PMC article. Review. - Dissecting the role of the 3-phosphoinositide-dependent protein kinase-1 (PDK1) signalling pathways.
Bayascas JR. Bayascas JR. Cell Cycle. 2008 Oct;7(19):2978-82. doi: 10.4161/cc.7.19.6810. Epub 2008 Oct 18. Cell Cycle. 2008. PMID: 18802401 Review.
Cited by
- Dysregulation of Lymphatic Endothelial VEGFR3 Signaling in Disease.
Kuonqui K, Campbell AC, Sarker A, Roberts A, Pollack BL, Park HJ, Shin J, Brown S, Mehrara BJ, Kataru RP. Kuonqui K, et al. Cells. 2023 Dec 28;13(1):68. doi: 10.3390/cells13010068. Cells. 2023. PMID: 38201272 Free PMC article. Review. - Exosomes derived from M2 macrophages induce angiogenesis to promote wound healing.
Lyu L, Cai Y, Zhang G, Jing Z, Liang J, Zhang R, Dang X, Zhang C. Lyu L, et al. Front Mol Biosci. 2022 Oct 11;9:1008802. doi: 10.3389/fmolb.2022.1008802. eCollection 2022. Front Mol Biosci. 2022. PMID: 36304927 Free PMC article. - MiR-34b-3p Impaired HUVECs Viability and Migration via Targeting PDK1 in an In Vitro Model of Gestational Diabetes Mellitus.
Song F, Cai A, Ye Q, Chen X, Lin L, Hao X. Song F, et al. Biochem Genet. 2021 Dec;59(6):1381-1395. doi: 10.1007/s10528-021-10064-9. Epub 2021 Apr 15. Biochem Genet. 2021. PMID: 33856598 - Naringin inhibits colorectal cancer cell growth by repressing the PI3K/AKT/mTOR signaling pathway.
Cheng H, Jiang X, Zhang Q, Ma J, Cheng R, Yong H, Shi H, Zhou X, Ge L, Gao G. Cheng H, et al. Exp Ther Med. 2020 Jun;19(6):3798-3804. doi: 10.3892/etm.2020.8649. Epub 2020 Apr 7. Exp Ther Med. 2020. PMID: 32346444 Free PMC article. - Xuesaitong Protects Podocytes from Apoptosis in Diabetic Rats through Modulating PTEN-PDK1-Akt-mTOR Pathway.
Xue R, Zhai R, Xie L, Zheng Z, Jian G, Chen T, Su J, Gao C, Wang N, Yang X, Xu Y, Gui D. Xue R, et al. J Diabetes Res. 2020 Jan 21;2020:9309768. doi: 10.1155/2020/9309768. eCollection 2020. J Diabetes Res. 2020. PMID: 32051833 Free PMC article.
References
- Affolter, M., and C.J. Weijer. 2005. Signaling to cytoskeletal dynamics during chemotaxis. Dev. Cell. 9:19–34. - PubMed
- Alessi, D.R., S.R. James, C.P. Downes, A.B. Holmes, P.R. Gaffney, C.B. Reese, and P. Cohen. 1997. Characterization of a 3-phosphoinositide-dependent protein kinase which phosphorylates and activates protein kinase Balpha. Curr. Biol. 7:261–269. - PubMed
- Anderson, K.E., J. Coadwell, L.R. Stephens, and P.T. Hawkins. 1998. Translocation of PDK-1 to the plasma membrane is important in allowing PDK-1 to activate protein kinase B. Curr. Biol. 8:684–691. - PubMed
- Arrieumerlou, C., and T. Meyer. 2005. A local coupling model and compass parameter for eukaryotic chemotaxis. Dev. Cell. 8:215–227. - PubMed
Publication types
MeSH terms
Substances
LinkOut - more resources
Full Text Sources
Other Literature Sources
Molecular Biology Databases
Miscellaneous
