Parietal and superior frontal visuospatial maps activated by pointing and saccades - PubMed (original) (raw)
Parietal and superior frontal visuospatial maps activated by pointing and saccades
D J Hagler Jr et al. Neuroimage. 2007.
Abstract
A recent study from our laboratory demonstrated that parietal cortex contains a map of visual space related to saccades and spatial attention and identified this area as the likely human homologue of the lateral intraparietal (LIP). A human homologue for the parietal reach region (PRR), thought to preferentially encode planned hand movements, has also been recently proposed. Both of these areas, originally identified in the macaque monkey, have been shown to encode space with eye-centered coordinates. Functional magnetic resonance imaging (fMRI) of humans was used to test the hypothesis that the putative human PRR contains a retinotopic map recruited by finger pointing but not saccades and to test more generally for differences in the visuospatial maps recruited by pointing and saccades. We identified multiple maps in both posterior parietal cortex and superior frontal cortex recruited for eye and hand movements, including maps not observed in previous mapping studies. Pointing and saccade maps were generally consistent within single subjects. We have developed new group analysis methods for phase-encoded data, which revealed subtle differences between pointing and saccades, including hemispheric asymmetries, but we did not find evidence of pointing-specific maps of visual space.
Figures
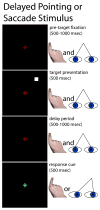
Figure 1
Stimulus schematic: delayed finger pointing or saccades to visual targets. While viewing a central fixation cross, subjects were presented with a peripheral target, followed by a variable delay. When the fixation cross changed colors, subjects moved their eyes to or pointed their right index finger in the direction of the remembered location of the target. The subjects’ hands were not visible to themselves.
Figure 2
Cortical areas recruited by eye movements and finger pointing. Randomized block design experiments were used to localize the areas involved in the visuomotor transformations necessary to make eye or hand movements to visual targets. Surface-based group analysis results, thresholded at p < 0.05 (n=22, corrected for multiple comparisons), are shown on inflated cortical surfaces. Activations to either pointing or saccades relative to fixation are shown on the left with superimposed “pointingANDsaccade” ROIs. The difference in activation between pointing and saccades is shown on the right with superimposed “pointingVSsaccade” ROIs outlining those areas with greater pointing activity. Pointing-specific activity is shown as positive, or redish-orange, and saccade-specific activity is shown as negative, or blue.
Figure 3
Empirical validation of complex F-statistic. Monte Carlo simulation was done to generate a probability density function for the complex F-statistic calculated with Equation 1. Vertical bars show the frequency of occurrence of different complex F-statistic values (10,000 iterations, n=13). Black circles and connecting line show the theoretical distribution for an F-statistic with 2 and 24 (i.e. 2n−2) degrees of freedom.
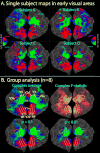
Figure 4
Demonstration of phase-encoded group analysis in early visual areas. A. Single subject phase-encoded mapping data in response to a rotating flashing checkerboard wedge is shown on flattened occipital patches (left and right hemispheres) after resampling to a common space via sulcal alignment. Data were thresholded to p<10−2, ipsilateral phases were truncated (amplitudes set to zero for vertices with ipsilateral phase), and finally the complex data were smoothed with an effective blurring kernel of 4 mm. B. Group analysis of mapping data. The upper left image shows the complex group average with ipsilateral phases truncated. Estimated borders between the early visual areas are shown as white lines. The upper right image shows the corresponding complex F-statistics calculated using Equation 1. F-statistics were scaled using a sigmoid function with a mid-point value of 4 and a slope of 0.1. The bottom row of images shows the complex average after applying two different statistical masks (p < 0.1 or p < 0.01) generated from the F-statistics. Cluster exclusion was used to correct for multiple comparisons (corrected p < 0.05; clusters > 228 mm2 for p < 0.1, clusters > 66 mm2 for p < 0.01).
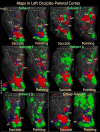
Figure 5
Pointing and saccade maps of visual space in left parietal cortex. Single subject pointing and saccade maps for five exemplary subjects are compared to the group average maps (n = 13). Preferred polar angle (i.e. phase of periodic stimulus) is represented by different colors as indicated by the color wheel key. The inflated left hemisphere cortical surfaces are shown from a dorsal-posterior view, including the occipital pole to the post-central sulcus. Single subject maps were thresholded at p < 0.01 (uncorrected for multiple comparisons). Group average maps were thresholded at p < 0.05 (corrected for multiple comparisons with cluster exclusion). Ipsilateral phases were truncated.
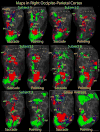
Figure 6
Pointing and saccade maps of visual space in right parietal cortex. Single subject pointing and saccade maps for five exemplary subjects are compared to the group average maps (n = 13). Preferred polar angle (i.e. phase of periodic stimulus) is represented by different colors as indicated by the color wheel key. The inflated right hemisphere cortical surfaces are shown from a dorsal-posterior view, including the occipital pole to the post-central sulcus. Single subject maps were thresholded at p < 0.01 (uncorrected for multiple comparisons). Group average maps were thresholded at p < 0.05 (corrected for multiple comparisons with cluster exclusion). Ipsilateral phases were truncated.
Figure 7
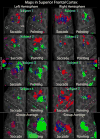
Pointing and saccade maps of visual space in superior frontal cortex. Single subject pointing and saccade maps for five exemplary subjects are compared to the group average maps (n = 13). Preferred polar angle (i.e. phase of periodic stimulus) is represented by different colors as indicated by the color wheel key. The inflated right and left hemisphere cortical surfaces are shown from a dorsal view of the superior frontal cortex, including the central sulcus and posterior part of the superior frontal sulcus. Single subject maps were thresholded at p < 0.01 (uncorrected for multiple comparisons). Group average maps were thresholded at p < 0.05 (corrected for multiple comparisons with cluster exclusion). Ipsilateral phases were truncated.
Figure 8
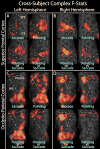
Cross-subject complex F-statistics. A–D. Complex F-statistics, scaled with a sigmoid function with mid-point of 4 and slope of 0.1, are shown on inflated cortical surface. Data were thresholded at p < 0.01 and clusters > 66 mm2 (p < 0.05, corrected for multiple comparisons). A & B. Superior Frontal Cortex. C & D. Occipito-parietal cortex. A & C. Left hemisphere. B & D. Right hemisphere. For each of A–D, “Pointing OR Saccade” images are the cross-subject, complex F-stats from the within-subject sums of pointing and saccade phase-encoded data, and “Pointing VS Saccade” images are from the within-subject difference between pointing and saccade data.
Figure 9
ROI analysis of contralateral-preference. Left and right hemisphere cortical surfaces are shown with overlayed outlines of ROIs defined by block-design group statistics (see methods). On the left, ROIs were defined by areas activated by both pointing and saccades. On the right, ROIs were defined by areas with activity greater for pointing than saccades. ROIs with significant contra-preference (signed amplitude of phase-encoded mapping data; see methods) are annotated with a “+”, blue for pointing and red for saccades. ROIs with ipsilateral preference are annotated with a “−“. Two ROIs, one in left medial frontal cortex, and the other in lateral occipital cortex, are annotated with a blue “*”, indicating a significantly stronger contra-preference for pointing than for saccades.
Figure 10
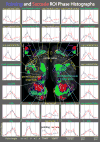
Phase histographs comparing pointing and saccade map activity. In the center, combined pointing and saccade group average maps (average of within-subject sums of pointing and saccade mapping data) are shown on left and right hemisphere cortical surfaces with overlayed ROIs defined by phase-encoded group statistics (see methods). PointingANDsaccade ROIs are outlined in cyan and pointingVSsaccade ROIs are outlined in yellow. In the surround, average phase histographs are shown for selected ROIs, with pointing plotted in blue and saccades plotted in red. Normalized surface area is plotted for each of 8 phase bins, with error bars representing the standard error of the cross-subject mean. The x-axis is divided into four quarters: lower ipsilateral, lower contralateral, upper contralateral, and upper ipsilateral. Phase = 0 corresponds to the middle of contralateral visual space. Normalized surface area is plotted along the y-axis, ranging from 0 to 0.5.
Similar articles
- A comparison of frontoparietal fMRI activation during anti-saccades and anti-pointing.
Connolly JD, Goodale MA, DeSouza JF, Menon RS, Vilis T. Connolly JD, et al. J Neurophysiol. 2000 Sep;84(3):1645-55. doi: 10.1152/jn.2000.84.3.1645. J Neurophysiol. 2000. PMID: 10980034 Clinical Trial. - FMRI evidence for a 'parietal reach region' in the human brain.
Connolly JD, Andersen RA, Goodale MA. Connolly JD, et al. Exp Brain Res. 2003 Nov;153(2):140-5. doi: 10.1007/s00221-003-1587-1. Epub 2003 Sep 4. Exp Brain Res. 2003. PMID: 12955383 - Differential parietal activations for spatial remapping and saccadic control in a visual memory task.
Pierce JE, Saj A, Vuilleumier P. Pierce JE, et al. Neuropsychologia. 2019 Aug;131:129-138. doi: 10.1016/j.neuropsychologia.2019.05.010. Epub 2019 May 16. Neuropsychologia. 2019. PMID: 31102598 - The relationship between spatial attention and saccades in the frontoparietal network of the monkey.
Wardak C, Olivier E, Duhamel JR. Wardak C, et al. Eur J Neurosci. 2011 Jun;33(11):1973-81. doi: 10.1111/j.1460-9568.2011.07710.x. Eur J Neurosci. 2011. PMID: 21645093 Review. - Maps of space in human frontoparietal cortex.
Jerde TA, Curtis CE. Jerde TA, et al. J Physiol Paris. 2013 Dec;107(6):510-6. doi: 10.1016/j.jphysparis.2013.04.002. Epub 2013 Apr 18. J Physiol Paris. 2013. PMID: 23603831 Free PMC article. Review.
Cited by
- Decision-making processes in perceptual learning depend on effectors.
Ivanov V, Manenti GL, Plewe SS, Kagan I, Schwiedrzik CM. Ivanov V, et al. Sci Rep. 2024 Mar 7;14(1):5644. doi: 10.1038/s41598-024-55508-5. Sci Rep. 2024. PMID: 38453977 Free PMC article. - Cortical field maps across human sensory cortex.
Brewer AA, Barton B. Brewer AA, et al. Front Comput Neurosci. 2023 Dec 15;17:1232005. doi: 10.3389/fncom.2023.1232005. eCollection 2023. Front Comput Neurosci. 2023. PMID: 38164408 Free PMC article. Review. - Egomotion-related visual areas respond to goal-directed movements.
Bellagamba M, Sulpizio V, Fattori P, Galati G, Galletti C, Maltempo T, Pitzalis S. Bellagamba M, et al. Brain Struct Funct. 2022 Sep;227(7):2313-2328. doi: 10.1007/s00429-022-02523-9. Epub 2022 Jun 28. Brain Struct Funct. 2022. PMID: 35763171 - Topological Maps and Brain Computations From Low to High.
Sereno MI, Sood MR, Huang RS. Sereno MI, et al. Front Syst Neurosci. 2022 May 27;16:787737. doi: 10.3389/fnsys.2022.787737. eCollection 2022. Front Syst Neurosci. 2022. PMID: 35747394 Free PMC article. - Effector-selective modulation of the effective connectivity within frontoparietal circuits during visuomotor tasks.
Bencivenga F, Tullo MG, Maltempo T, von Gal A, Serra C, Pitzalis S, Galati G. Bencivenga F, et al. Cereb Cortex. 2023 Mar 10;33(6):2517-2538. doi: 10.1093/cercor/bhac223. Cereb Cortex. 2023. PMID: 35709758 Free PMC article.
References
- Bandettini PA, Jesmanowicz A, Wong EC, Hyde JS. Processing strategies for time-course data sets in functional MRI of the human brain. Magn Reson Med. 1993;30:161–173. - PubMed
- Barash S, Bracewell RM, Fogassi L, Gnadt JW, Andersen RA. Saccade-related activity in the lateral intraparietal area. II. Spatial properties. J Neurophysiol. 1991;66:1109–1124. - PubMed
- Batista AP, Buneo CA, Snyder LH, Andersen RA. Reach plans in eye-centered coordinates. Science. 1999;285:257–260. - PubMed
Publication types
MeSH terms
Grants and funding
- F32 MH066578/MH/NIMH NIH HHS/United States
- F32 MH066578-01A1/MH/NIMH NIH HHS/United States
- F32 MH066578-02/MH/NIMH NIH HHS/United States
- 5F32MH066578-02/MH/NIMH NIH HHS/United States
LinkOut - more resources
Full Text Sources
Other Literature Sources
