Inhibition of recombinant N-type Ca(V) channels by the gamma 2 subunit involves unfolded protein response (UPR)-dependent and UPR-independent mechanisms - PubMed (original) (raw)
Comparative Study
Inhibition of recombinant N-type Ca(V) channels by the gamma 2 subunit involves unfolded protein response (UPR)-dependent and UPR-independent mechanisms
Alejandro Sandoval et al. J Neurosci. 2007.
Abstract
Auxiliary gamma subunits are an important component of high-voltage-activated calcium (Ca(V)) channels, but their precise regulatory role remains to be determined. In the current report, we have used complementary approaches including molecular biology and electrophysiology to investigate the influence of the gamma subunits on neuronal Ca(V) channel activity and expression. We found that coexpression of gamma2 or gamma3 subunits drastically inhibited macroscopic currents through recombinant N-type channels (Ca(V)2.2/beta3/alpha2delta) in HEK-293 cells. Using inhibitors of internalization, we found that removal of functional channels from the plasma membrane is an improbable mechanism of current regulation by gamma. Instead, changes in current amplitude could be attributed to two distinct mechanisms. First, gamma subunit expression altered the voltage dependence of channel activity. Second, gamma subunit expression reduced N-type channel synthesis via activation of the endoplasmic reticulum unfolded protein response. Together, our findings (1) corroborate that neuronal gamma subunits significantly downregulate Ca(V)2.2 channel activity, (2) uncover a role for the gamma2 subunit in Ca(V)2.2 channel expression through early components of the biosynthetic pathway, and (3) suggest that, under certain conditions, channel protein misfolding could be induced by interactions with the gamma subunits, supporting the notion that Ca(V) channels constitute a class of difficult-to-fold proteins.
Figures
Figure 1.
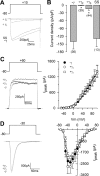
The CaVγ2 and CaVγ3 auxiliary subunits specifically inhibit current through CaV2.2/CaVα2δ/CaVβ3 channels heterologously expressed in HEK-293 cells. A, Representative current traces from control cells (−γ) or cells coexpressing either the CaVγ2 or CaVγ3 subunits or the 4TM protein sarcospan (SS). Currents were elicited by voltage steps to +10 mV from a holding potential of −80 mV. B, Comparison of _I_Ba density in individual HEK-293 cells determined as the current amplitude at _V_m of +10 mV normalized by cell capacitance (picoamperes per picofarad). The number of tested cells is listed in parentheses. C, Left, Representative traces of endogenous macroscopic K+ currents elicited by step changes in membrane potential from −80 to +60 mV in untransfected HEK-293 cells (−γ) or cells expressing the CaVγ subunits. Right, Relationship between _I_Ba [measured at its maximum amplitude after the step change in membrane potential (_V_m) from a holding potential of −80 mV] and membrane voltage in control (n = 10) and CaVγ-expressing cells (n = 10). D, Left, Representative traces of macroscopic currents through low-threshold channels of the CaV3.2 class. Currents were recorded from HEK-293 cells stably expressing CaV3.2 channels in the absence (−γ) or presence of the CaVγ subunits in response to depolarizing steps to −30 mV. Right, Averaged peak currents plotted against the test potential under the indicated experimental conditions. Currents were activated from a holding potential of −80 mV by voltage steps applied at 0.05 Hz to various test potentials between −70 and +70 mV (n = 10–18). The asterisks denote significant differences (p < 0.05) compared with control. Error bars indicate SEM.
Figure 2.
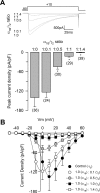
The CaVγ2 subunit inhibits recombinant N-type Ca2+ channels in a concentration-dependent manner. A, Representative Ba2+ currents recorded (top) and comparison of averaged peak current density (bottom) in HEK-293 cells expressing CaV2.2(α1B)/CaVα2δ/CaVβ3 channels. Currents were elicited by depolarizing pulses to +10 mV from a holding potential of −80 mV, in the absence (1:0) and the presence of different concentrations of CaVγ2 cDNA in the transfection mixture. B, I–V relationships for peak _I_Ba density through CaV2.2/CaVα2δ/CaVβ3 channels in control cells (−γ2) and cells coexpressing the CaVγ2 cDNA in molar ratios ranging from 1:0.1 to 1:1.4 in relation to the CaV2.2 subunit (n = 12–14). Error bars indicate SEM, and the asterisks denote significant differences (p < 0.05) compared with control.
Figure 3.
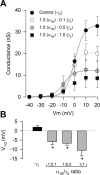
The CaVγ2 subunit regulates whole-cell conductance. A, Voltage dependence of activation of recombinant N-type [CaV2.2(α1B)/CaVα2δ/CaVβ3] channels in control cells (−γ2) or cells cotransfected with different concentrations of the cDNA encoding the CaVγ2 subunit. Conductance data were derived from Figure 2_B_ using the expression: G = I/(_V_m − _V_rev), where I is current, G is conductance, _V_m is the test potential, and _V_rev is the extrapolated reversal potential. The mean data were fitted with Boltzmann functions of the form G = _G_max/(1 + exp[(_V_m − _V_1/2)/_k_]−1), where _G_max is maximum conductance, _V_m is the test potential, _V_1/2 is the potential for half-maximal activation of _G_max, and k is a slope factor. B, Comparison of the mean half-activation voltage (_V_1/2) for CaV2.2/CaVα2δ/CaVβ3 channels alone (−γ2) or coexpressed with the CaVγ2 subunit (n = 12–14). Error bars indicate SEM, and the asterisks denote significant differences (p < 0.05) compared with control.
Figure 4.
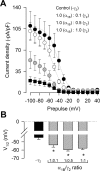
CaVγ2 regulates CaV2.2(α1B)/CaVα2δ/CaVβ3 channel steady-state inactivation. A, Voltage dependence of steady-state inactivation of N-type recombinant channels in the absence and presence of CaVγ2. Currents were recorded after conditioning pulses of 2 s duration, applied from a holding potential of −80 mV in 10 mV steps between −100 and +40 mV, followed by a 140 ms test pulse to +10 mV. Data are plotted against the conditioning potentials (n = 6–12). The mean data were fitted with a Boltzmann function of the following form: _I_Ba = _I_max/(1 + exp[(_V_m − _V_1/2)/_k_]), where the current amplitude _I_Ba has decreased to a half-amplitude at _V_1/2 with an _e_-fold change over k mV. B, Comparison of the mean half-inactivation voltage (_V_1/2) for CaV2.2/CaVα2δ/CaVβ3 channels alone (−γ2) or coexpressed with the CaVγ2 subunit (n = 6–12). The asterisks denote significant differences (p < 0.05) compared with control. Error bars indicate SEM.
Figure 5.
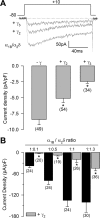
Regulation of CaV2.2 channel currents by CaVγ2 is not dependent on the presence of the CaVβ auxiliary subunits. A, Representative current traces from control cells [HEK-293 cells expressing CaV2.2(α1B)/α2δ channels in absence of the CaVβ subunit] and cells coexpressing either the CaVγ2 or the CaVγ3 subunits. Currents were elicited by voltage steps to +10 mV from a holding potential of −80 mV. Bottom, Comparison of _I_Ba density in HEK-293 cells determined as the current amplitude at _V_m of +10 mV normalized by cell capacitance (picoamperes per picofarad). B, _I_Ba density determined in cells cotransfected with CaV2.2/β3 and varying molar ratios of the cDNA for the CaVα2δ subunit in absence (black bars) and presence of CaVγ2 (gray bars). The number of recorded cells is listed in parentheses. The asterisks denote significant differences (p < 0.05) compared with control.
Figure 6.
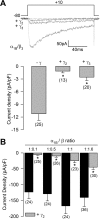
Regulation of CaV2.2 channel currents by CaVγ2 is not dependent on the presence of CaVα2δ. A, Superimposed whole-cell current traces from control cells [HEK-293 cells expressing CaV2.2(α1B)/β3 channels in the absence of the CaVα2δ subunit] and cells coexpressing either the CaVγ2 or the CaVγ3 subunits. Bottom, Comparison of _I_Ba density in HEK-293 cells determined at _V_m of +10 mV. B, _I_Ba density determined in cells cotransfected with CaV2.2/α2δ and varying molar ratios of the cDNA for CaVβ3 in absence (black bars) and presence of the CaVγ2 subunit (gray bars). The number of recorded cells is listed in parentheses. The asterisks denote significant differences (p < 0.05) compared with control.
Figure 7.
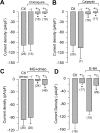
The actions of the CaVγ2 and CaVγ3 subunits are not prevented by inhibition of internalization. A, B, Mean _I_Ba density in HEK-293 cells expressing CaV2.2/CaVα2δ/CaVβ3/CaVγx subunits before (control) and after application of chloroquine (100 μ
m
) and calpeptin (40 μ
m
) at 37°C for 6 h, respectively. C, Mean _I_Ba density in transfected HEK-293 cells before and after application of MG-132 (25 μ
m
at 37°C for 6 h). Control cells (expressing CaV2.2/CaVα2δ/CaVβ3 channels in absence of the CaVγ subunits) were incubated for 6 h in the presence of the drug (MG-132) or the vehicle alone (dmso). D, Mean _I_Ba density in nonexpressing CaVγ HEK-293 cells (control), and cells cotransfected with CaV2.2/CaVα2δ/CaVβ3/CaVγ2 before (+γ2) and after (+γ2 E-64) acute exposure to the protease inhibitor E-64 (50 μ
m
at 37°C for 6 h). In all cases, currents were elicited by depolarizing test pulses to +10 mV from a holding potential of −80 mV. Bars denote mean ± SE; the number of recorded cells is indicated in parentheses. The asterisks denote significant differences (p < 0.05) compared with control.
Figure 8.
Mutation at site N48 in the first extracellular loop does not disrupt the function of CaVγ2. A, Schematic representation of the CaVγ2 subunit. The position of the asparagine residue substituted is indicated. Bottom, Superimposed representative whole-cell Ba2+ current traces through CaV2.2/CaVα2δ/CaVβ3 in HEK-293 cells in the absence of the CaVγ subunit (control) and cells expressing the wild-type CaVγ2 (+γ2) or the N → Q mutant (N48Q). Currents were generated by applying 140 ms activating pulses at +10 mV from a holding potential of −80 mV. B, Mean _I_Ba density in HEK-293 cells as in A. Bars denote mean ± SE; the number of recorded cells is indicated in parentheses. *p < 0.05 compared with control.
Figure 9.
Reduction of macroscopic N-type current after CaVγ2 transfection may involve alterations in surface expression and interference with the synthesis of new channels. Flow cytometric analysis of the percentage of fluorescent cells and fluorescence intensity in untransfected HEK-293 cells, cells expressing CaV2.2/CaVα2δ/CaVβ3 channels (control), and cells cotransfected with the recombinant N-type channels plus the CaVγ2 subunit (+γ2). The histograms denote mean ± SEM values, and the data are representative of two independent experiments of channels probed with an anti-CaVα2δ affinity-purified antibody. Samples were run in triplicate and 1–2 × 10⁴ cells were measured per run. The asterisks denote significant differences (p < 0.05) compared with control. Ab, Antibody; Ctl, control untransfected cells.
Figure 10.
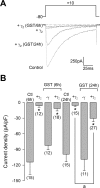
Extracellular application of genistein, an inhibitor of the UPR, antagonizes of the suppressive effect of CaVγ2 on the N-type current expressed in the HEK-293 cells. A, Representative Ba2+ currents through recombinant N-type channels obtained in HEK-293 cells expressing CaV2.2/CaVα2δ/CaVβ3 channels either in the absence (control) or presence of CaVγ2 plus genistein (140 μ
m
at 37°C for 6 or 24 h). Control conditions included exposure to ∼0.1% dimethyl sulfoxide (the vehicle for genistein). Currents were evoked by step depolarizations to +10 mV from a holding potential of −80 mV. B, Mean _I_Ba density in transfected HEK-293 cells as in A. Statistical significance (p < 0.05) compared with respective control (*) or CaVγ2 plus vehicle alone (a) is indicated. Ctl, Control; GST, genistein.
Figure 11.
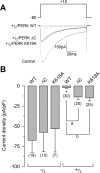
Coexpression of two dominant-negative constructs of the endoplasmic reticulum-resident RNA-dependent kinase (PERK) causes a reversal of current suppression observed after transfection of CaVγ2. A, Examples of Ba2+ currents elicited by 140 ms depolarizing pulses to +10 mV from a holding potential of −80 mV in HEK-293 cells expressing CaV2.2/CaVα2δ/CaVβ3 channels either in the absence (control) or presence of CaVγ2 plus wild-type PERK, or the mutant constructs PERK ΔC and PERK K618A. B, Mean _I_Ba density in transfected HEK-293 cells as in A. Statistical significance (p < 0.05) compared with control (*) or wild-type PERK (a, b) is indicated.
Figure 12.
CaVγ2 transfection inhibits Ca2+ channel activity in neonatal DRG neurons. A, Representative traces of whole-cell _I_Ba through CaV channels in cultured DRG neurons transfected with either GFP alone (control) and GFP plus CaVγ2. The currents were evoked by a single depolarizing step from a holding potential of −80 to +10 mV for 140 ms. B, Comparison of averaged peak current density in DRG cells expressing GFP alone (control) and the exogenous CaVγ2 subunit. Currents were elicited as in A.
Similar articles
- Voltage-dependent calcium channels.
Lacinová L. Lacinová L. Gen Physiol Biophys. 2005 Jun;24 Suppl 1:1-78. Gen Physiol Biophys. 2005. PMID: 16096350 Review. - Inhibition of recombinant N-type and native high voltage-gated neuronal Ca2+ channels by AdGABA: mechanism of action studies.
Martínez-Hernández E, Sandoval A, González-Ramírez R, Zoidis G, Felix R. Martínez-Hernández E, et al. Toxicol Appl Pharmacol. 2011 Feb 1;250(3):270-7. doi: 10.1016/j.taap.2010.10.030. Epub 2010 Nov 6. Toxicol Appl Pharmacol. 2011. PMID: 21059371 - Ba2+ currents in inner and outer hair cells of mice lacking the voltage-dependent Ca2+ channel subunits beta3 or beta4.
Kuhn S, Knirsch M, Rüttiger L, Kasperek S, Winter H, Freichel M, Flockerzi V, Knipper M, Engel J. Kuhn S, et al. Channels (Austin). 2009 Sep-Oct;3(5):366-76. doi: 10.4161/chan.3.5.9774. Epub 2009 Sep 17. Channels (Austin). 2009. PMID: 19755851 - Auxiliary subunit regulation of high-voltage activated calcium channels expressed in mammalian cells.
Yasuda T, Chen L, Barr W, McRory JE, Lewis RJ, Adams DJ, Zamponi GW. Yasuda T, et al. Eur J Neurosci. 2004 Jul;20(1):1-13. doi: 10.1111/j.1460-9568.2004.03434.x. Eur J Neurosci. 2004. PMID: 15245474 - Functional biology of the alpha(2)delta subunits of voltage-gated calcium channels.
Davies A, Hendrich J, Van Minh AT, Wratten J, Douglas L, Dolphin AC. Davies A, et al. Trends Pharmacol Sci. 2007 May;28(5):220-8. doi: 10.1016/j.tips.2007.03.005. Epub 2007 Apr 2. Trends Pharmacol Sci. 2007. PMID: 17403543 Review.
Cited by
- gamma1-dependent down-regulation of recombinant voltage-gated Ca2+ channels.
Sandoval A, Arikkath J, Monjaraz E, Campbell KP, Felix R. Sandoval A, et al. Cell Mol Neurobiol. 2007 Nov;27(7):901-8. doi: 10.1007/s10571-007-9210-9. Epub 2007 Oct 13. Cell Mol Neurobiol. 2007. PMID: 17934806 Free PMC article. - Genetic basis of pain variability: recent advances.
Young EE, Lariviere WR, Belfer I. Young EE, et al. J Med Genet. 2012 Jan;49(1):1-9. doi: 10.1136/jmedgenet-2011-100386. Epub 2011 Nov 5. J Med Genet. 2012. PMID: 22058430 Free PMC article. Review. - Expression of tiRNA and tRF in APP/PS1 transgenic mice and the change of related proteins expression.
Lu H, Liu L, Han S, Wang B, Qin J, Bu K, Zhang Y, Li Z, Ma L, Tian J, Zhang K, Li T, Cui H, Liu X. Lu H, et al. Ann Transl Med. 2021 Sep;9(18):1457. doi: 10.21037/atm-21-4318. Ann Transl Med. 2021. PMID: 34734009 Free PMC article. - Regulation of high-voltage-activated Ca2+ channel function, trafficking, and membrane stability by auxiliary subunits.
Felix R, Calderón-Rivera A, Andrade A. Felix R, et al. Wiley Interdiscip Rev Membr Transp Signal. 2013 Sep 1;2(5):207-220. doi: 10.1002/wmts.93. Wiley Interdiscip Rev Membr Transp Signal. 2013. PMID: 24949251 Free PMC article. - Susceptibility to chronic pain following nerve injury is genetically affected by CACNG2.
Nissenbaum J, Devor M, Seltzer Z, Gebauer M, Michaelis M, Tal M, Dorfman R, Abitbul-Yarkoni M, Lu Y, Elahipanah T, delCanho S, Minert A, Fried K, Persson AK, Shpigler H, Shabo E, Yakir B, Pisanté A, Darvasi A. Nissenbaum J, et al. Genome Res. 2010 Sep;20(9):1180-90. doi: 10.1101/gr.104976.110. Epub 2010 Aug 5. Genome Res. 2010. PMID: 20688780 Free PMC article.
References
- Arikkath J, Campbell KP. Auxiliary subunits: essential components of the voltage-gated calcium channel complex. Curr Opin Neurobiol. 2003;13:298–307. - PubMed
- Arikkath J, Chen CC, Ahern C, Allamand V, Flanagan JD, Coronado R, Gregg RG, Campbell KP. γ1 subunit interactions within the skeletal muscle L-type voltage-gated calcium channels. J Biol Chem. 2003;278:1212–1219. - PubMed
- Avila T, Andrade A, Felix R. Transforming growth factor-beta1 and bone morphogenetic protein-2 downregulate CaV3.1 channel expression in mouse C2C12 myoblasts. J Cell Physiol. 2006;209:448–456. - PubMed
- Berridge MJ. Neuronal calcium signaling. Neuron. 1998;21:13–26. - PubMed
Publication types
MeSH terms
Substances
LinkOut - more resources
Full Text Sources
Miscellaneous
