Development of an advanced electrochemical DNA biosensor for bacterial pathogen detection - PubMed (original) (raw)
Development of an advanced electrochemical DNA biosensor for bacterial pathogen detection
Joseph C Liao et al. J Mol Diagn. 2007 Apr.
Abstract
Electrochemical sensors have the capacity for rapid and accurate detection of a wide variety of target molecules in biological fluids. We have developed an electrochemical sensor assay involving hybridization of bacterial 16S rRNA to fluorescein-modified detector probes and to biotin-modified capture probes anchored to the sensor surface. Signal is generated by an oxidation-reduction current produced by the action of horseradish peroxidase conjugated to an anti-fluorescein monoclonal Fab. A previous study found that this electrochemical sensor strategy could identify uropathogens in clinical urine specimens. To improve assay sensitivity, we examined the key steps that affect the current amplitude of the electrochemical signal. Efficient lysis and release of 16S rRNA from both gram-negative and -positive bacteria was achieved with an initial treatment with Triton X-100 and lysozyme followed by alkaline lysis, resulting in a 12-fold increase in electrochemical signal compared with alkaline lysis alone. The distance in nucleotides between the target hybridization sites of the detector and capture probes and the location of fluorescein modification on the detector probe contributed to a 23-fold change in signal intensity. These results demonstrate the importance of target-probe and probe-probe interactions in the detection of bacterial 16S rRNA using an electrochemical DNA sensor approach.
Figures
Figure 1
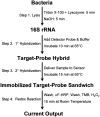
Flow chart showing the steps involved in the process of bacterial detection using the electrochemical sensor. Step 1: Bacterial lysis to release the 16S rRNA target. Step 2: Primary hybridization of the 16S rRNA target with the fluorescein-modified detector probe. Step 3: Secondary hybridization of the target-detector probe hybrid to the capture probe on the sensor surface. Step 4: Redox reaction generated by addition of anti-fluorescein horseradish peroxidase (αF-HRP), TMB substrate, and H2O2. The amount of time required for each step is shown. Washing occurs only before and after the addition of αF-HRP. The entire assay was performed within 50 minutes.
Figure 2
Effect of lysis conditions on electrochemical signal intensity. Enterococcus cells (105) were exposed to NaOH, Triton X-100 (Tx), and/or lysozyme (Lzm) at room temperature followed by direct electrochemical detection of released 16S rRNA using _Enterococcus_-specific capture (EF207C) and detector (EF165D) probes. The lysis conditions were as follows: 1) NaOH for 10 minutes; 2) Triton X-100 for 5 minutes, followed by NaOH for 5 minutes; 3) Triton X-100 and lysozyme for 10 minutes; 4) NaOH for 5 minutes, followed by Triton X-100 and lysozyme for 5 minutes; and 5) Triton X-100 and lysozyme for 5 minutes, followed by NaOH for 5 minutes. Mean and SD of experiments performed in duplicate are shown. Background signal was determined in negative control experiments performed with capture and detector probes but without bacterial lysate. Conditions 3, 4, and 5 produced results that were significantly greater than negative control (P < 0.01).
Figure 3
Electrochemical signal intensity as a function of the distance (in nucleotides) between the capture and detector probe hybridization sites on the 16S rRNA target. Current output (in nanoamperes) was measured using capture probe EC434C and various 3′-fluorescein-modified detector probes hybridized to 16S rRNA released from 4.2 × 10⁷ E. coli. Mean and SD of experiments performed in duplicate are shown. Background signal was determined in negative control (NC) experiments performed with capture and detector probes but without bacterial lysate. There was a negative correlation (r = −0.84) between signal intensity and the number of nucleotides between the capture and detector probe hybridization sites. The signal intensity obtained using capture and detector probes hybridizing to adjacent (0-nucleotide gap) sites produced an electrochemical signal significantly greater than that obtained using detector probes hybridizing ≥3 nucleotides away from the capture probe hybridization site (P < 0.01).
Figure 4
Electrochemical signal intensity as a function of location of probe hybridization and fluorescein modification. A: Signal intensity was measured using the _Enterococcus_-specific capture probe EF C207 paired with 3′- or 5′-fluorescein-modified detector probes hybridizing to the enterococcal 16S target at a site adjacent to (EF D171) or six nucleotides removed from (EF D165) the capture probe. B: Signal intensity was measured using 3′- or 5′-fluorescein-modified detector probe EC393D paired with the _E. coli_-specific capture probes hybridizing to the E. coli 16S target at a site adjacent to (EC430C) or six nucleotides removed from (EC434C) the detector probe. The configurations of the capture and detector probes are shown schematically. Mean and SD of experiments performed in duplicate are shown.
Figure 5
Sensitivity of the electrochemical sensor assay as a function of locations of probe hybridization and fluorescein modification. A: Electrochemical sensor results from fivefold serial dilutions of enterococcal cells using capture probe EF207C paired with detector probes EF165D or EF171D modified by fluorescein at the 5′ and 3′ positions, respectively. B: Electrochemical sensor results from fivefold serial dilutions of E. coli cells using capture probe EC434C paired with detector probes EC393C or EC399C modified by fluorescein at the 5′ and 3′ positions, respectively. The dashed horizontal lines indicate current output thresholds for duplicate results significantly greater than negative control (P < 0.01). 3′-Fluorescein modification of the detector probe combined with continuity between the detector and capture probe hybridization sites resulted in a 23-fold improvement in sensitivity of electrochemical sensor assay for detection of enterococci (from 232,000 down to 9900 cells) and E. coli (from 6500 down to 280 cells).
Figure 6
Effects of a mixture of detector probes on electrochemical signal intensity. Lysates containing 16S rRNA from either Enterococcus or E. coli were hybridized with detector probes specific for Enterococcus, E. coli, or a mixture of both detector probes. In each experiment, the detector probe-16S rRNA hybrids were applied to electrochemical sensors functionalized with an _Enterococcus_-specific capture probe. Mean and SD of experiments performed in duplicate are shown. Background signal was determined in negative control (NC) experiments performed with capture and detector probes but without bacterial lysate. Experiments with the Enterococcus lysate show that there was no significant loss of signal intensity for detection of 16S rRNA target when hybridization was performed with a mixture of detector probes. Experiments with the E. coli lysate show that there was also no loss of capture probe specificity using a mixture of detector probes. Similar results were obtained with other two-, three-, and five-detector probe mixtures (data not shown).
Figure 7
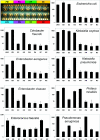
Results testing the specificity of the electrochemical sensor array. Lysates of nine ATCC strains were combined with a mixture of seven detector probes and applied to the surface of the 16-sensor array (top left) functionalized with seven different capture probes (see Materials and Methods for details and Table 1 for abbreviations). Negative control (NC) sensors to which no cell lysates were applied were used to measure background signal intensity. Mean and SD of log signal intensity from duplicate sensors are plotted on the vertical axes in antilog (nanoamperes) scale.
Figure 8
Relationship of variability to signal intensity. The mean signal intensity and SD for each of the 156 duplicate experiments reported in this study are included in this log-log plot, after excluding seven points with 0 SD. The pattern of the vertical scatter of the duplicates, the strong relationship between SD and mean, and analysis of the logarithm of the signal (see text) support a log normal distribution.
Similar articles
- Use of electrochemical DNA biosensors for rapid molecular identification of uropathogens in clinical urine specimens.
Liao JC, Mastali M, Gau V, Suchard MA, Møller AK, Bruckner DA, Babbitt JT, Li Y, Gornbein J, Landaw EM, McCabe ER, Churchill BM, Haake DA. Liao JC, et al. J Clin Microbiol. 2006 Feb;44(2):561-70. doi: 10.1128/JCM.44.2.561-570.2006. J Clin Microbiol. 2006. PMID: 16455913 Free PMC article. - Optimal probe length and target location for electrochemical detection of selected uropathogens at ambient temperature.
Mastali M, Babbitt JT, Li Y, Landaw EM, Gau V, Churchill BM, Haake DA. Mastali M, et al. J Clin Microbiol. 2008 Aug;46(8):2707-16. doi: 10.1128/JCM.00423-08. Epub 2008 Jun 18. J Clin Microbiol. 2008. PMID: 18562584 Free PMC article. - Rapid, species-specific detection of uropathogen 16S rDNA and rRNA at ambient temperature by dot-blot hybridization and an electrochemical sensor array.
Sun CP, Liao JC, Zhang YH, Gau V, Mastali M, Babbitt JT, Grundfest WS, Churchill BM, McCabe ER, Haake DA. Sun CP, et al. Mol Genet Metab. 2005 Jan;84(1):90-9. doi: 10.1016/j.ymgme.2004.11.006. Epub 2004 Dec 13. Mol Genet Metab. 2005. PMID: 15639199 - The use of DNA probes to detect and identify microorganisms.
Kohne DE. Kohne DE. Adv Exp Med Biol. 1990;263:11-35. doi: 10.1007/978-1-4613-0601-6_2. Adv Exp Med Biol. 1990. PMID: 2162130 Review. No abstract available. - Electrochemical molecular analysis without nucleic acid amplification.
Gau V, Ma SC, Wang H, Tsukuda J, Kibler J, Haake DA. Gau V, et al. Methods. 2005 Sep;37(1):73-83. doi: 10.1016/j.ymeth.2005.05.008. Epub 2005 Oct 4. Methods. 2005. PMID: 16213156 Free PMC article. Review.
Cited by
- Whole cell hybridisation for monitoring harmful marine microalgae.
Toebe K. Toebe K. Environ Sci Pollut Res Int. 2013 Oct;20(10):6816-23. doi: 10.1007/s11356-012-1416-9. Epub 2013 Jul 9. Environ Sci Pollut Res Int. 2013. PMID: 23835584 - DNA diagnostics: nanotechnology-enhanced electrochemical detection of nucleic acids.
Wei F, Lillehoj PB, Ho CM. Wei F, et al. Pediatr Res. 2010 May;67(5):458-68. doi: 10.1203/PDR.0b013e3181d361c3. Pediatr Res. 2010. PMID: 20075759 Free PMC article. Review. - In situ electrokinetic enhancement for self-assembled-monolayer-based electrochemical biosensing.
Sin ML, Liu T, Pyne JD, Gau V, Liao JC, Wong PK. Sin ML, et al. Anal Chem. 2012 Mar 20;84(6):2702-7. doi: 10.1021/ac203245j. Epub 2012 Mar 6. Anal Chem. 2012. PMID: 22397486 Free PMC article. - Rapid, Affordable, and Point-of-Care Water Monitoring Via a Microfluidic DNA Sensor and a Mobile Interface for Global Health.
Kim U, Ghanbari S, Ravikumar A, Seubert J, Figueira S. Kim U, et al. IEEE J Transl Eng Health Med. 2013 Sep 16;1:3700207. doi: 10.1109/JTEHM.2013.2281819. eCollection 2013. IEEE J Transl Eng Health Med. 2013. PMID: 27170858 Free PMC article. - Rapid Electrochemical-Based PCR-Less Microbial Quantification and Antimicrobial Susceptibility Profiling Directly From Blood and Urine With Unknown Microbial Load or Species.
Chen J, Navarro E, Nuñez E, Gau V. Chen J, et al. Front Bioeng Biotechnol. 2021 Sep 16;9:744198. doi: 10.3389/fbioe.2021.744198. eCollection 2021. Front Bioeng Biotechnol. 2021. PMID: 34604191 Free PMC article.
References
- Drummond TG, Hill MG, Barton JK. Electrochemical DNA sensors. Nat Biotechnol. 2003;21:1192–1199. - PubMed
- Gau JJ, Lan EH, Dunn B, Ho CM, Woo JC. A MEMS based amperometric detector for E. coli bacteria using self-assembled monolayers. Biosens Bioelectron. 2001;16:745–755. - PubMed
- Gooding JJ. Electrochemical DNA hybridization biosensor. Electroanalysis. 2002;14:1149–1156.
- Palecek E, Jelen F. Electrochemistry of nucleic acids and development of DNA sensors. Crit Rev Anal Chem. 2002;3:261–270.
- Wang J. Electrochemical nucleic acid biosensors. Anal Chim Acta. 2002;469:63–71.
Publication types
MeSH terms
Substances
LinkOut - more resources
Full Text Sources
Other Literature Sources


