High-resolution species trees without concatenation - PubMed (original) (raw)
Comparative Study
. 2007 Apr 3;104(14):5936-41.
doi: 10.1073/pnas.0607004104. Epub 2007 Mar 28.
Affiliations
- PMID: 17392434
- PMCID: PMC1851595
- DOI: 10.1073/pnas.0607004104
Comparative Study
High-resolution species trees without concatenation
Scott V Edwards et al. Proc Natl Acad Sci U S A. 2007.
Abstract
The vast majority of phylogenetic models focus on resolution of gene trees, despite the fact that phylogenies of species in which gene trees are embedded are of primary interest. We analyze a Bayesian model for estimating species trees that accounts for the stochastic variation expected for gene trees from multiple unlinked loci sampled from a single species history after a coalescent process. Application of the model to a 106-gene data set from yeast shows that the set of gene trees recovered by statistically acknowledging the shared but unknown species tree from which gene trees are sampled is much reduced compared with treating the history of each locus independently of an overarching species tree. The analysis also yields a concentrated posterior distribution of the yeast species tree whose mode is congruent with the concatenated gene tree but can do so with less than half the loci required by the concatenation method. Using simulations, we show that, with large numbers of loci, highly resolved species trees can be estimated under conditions in which concatenation of sequence data will positively mislead phylogeny, and when the proportion of gene trees matching the species tree is <10%. However, when gene tree/species tree congruence is high, species trees can be resolved with just two or three loci. These results make accessible an alternative paradigm for combining data in phylogenomics that focuses attention on the singularity of species histories and away from the idiosyncrasies and multiplicities of individual gene histories.
Conflict of interest statement
The authors declare no conflict of interest.
Figures
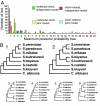
Fig. 1.
The distribution of gene trees for the 106-gene yeast data set. (A) The number of genes (y axis) yielding each of 24 topologies according to the maximum posterior probability criterion (x axis) is shown for each of four analyses: independent (green) and joint (yellow) model with a molecular clock and independent (red) and joint (blue) model without a molecular clock. (B) The two most commonly encountered maximum posterior probability trees (for both species and genes) are shown below, with the next four most common shown in the bottom row (trees 3–5 and 9). The asterisk in tree 1 indicates the branch whose length differed drastically between BEST and MCMCcoal (30). The complete posterior distribution of gene trees for all four analyses is given in
SI Tables 1–4
.
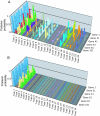
Fig. 2.
Shifting phylogenetic landscapes for gene trees under different models. The complete posterior probability distributions for the independent (A) and joint (B) models without a molecular clock are shown.
Fig. 3.
Robustness and efficiency of the joint model for estimating species trees. (A) The number of genes required to resolve the correct species tree with four and eight species when the proportion of gene trees matching the species tree is high. Here this proportion varies between ≈83% and 90% (in blue and green, 100 gene trees per simulation) because the critical internodes in the species tree are relatively long on the scale of the effective population size (θ). The gamma-distributed prior on θ for each node was (1, 200), indicating a mean θ of 1/200 and variance of 1/40,000. A prior mean of 1/200 is consistent with what we know about θ in natural populations of yeast (45, 46). (B) The number of genes required to resolve the correct four-species tree when the proportion of gene trees matching the species tree (in blue) is low (≈40%). Prior 1 on θ is (1, 200), and prior 2 is (1, 1,000). (C) The number of genes required to resolve the correct eight-species tree when the proportion of gene trees matching the species tree (in blue) is low (<10%). Prior 1 on θ is (1, 100), prior 2 is (1, 500), and prior 3 is (1, 1,000).
Similar articles
- Estimating species trees using multiple-allele DNA sequence data.
Liu L, Pearl DK, Brumfield RT, Edwards SV. Liu L, et al. Evolution. 2008 Aug;62(8):2080-91. doi: 10.1111/j.1558-5646.2008.00414.x. Epub 2008 May 5. Evolution. 2008. PMID: 18462214 - Coalescent methods for estimating phylogenetic trees.
Liu L, Yu L, Kubatko L, Pearl DK, Edwards SV. Liu L, et al. Mol Phylogenet Evol. 2009 Oct;53(1):320-8. doi: 10.1016/j.ympev.2009.05.033. Epub 2009 Jun 6. Mol Phylogenet Evol. 2009. PMID: 19501178 Review. - Challenges in Species Tree Estimation Under the Multispecies Coalescent Model.
Xu B, Yang Z. Xu B, et al. Genetics. 2016 Dec;204(4):1353-1368. doi: 10.1534/genetics.116.190173. Genetics. 2016. PMID: 27927902 Free PMC article. Review.
Cited by
- Coalescent simulations reveal hybridization and incomplete lineage sorting in Mediterranean Linaria.
Blanco-Pastor JL, Vargas P, Pfeil BE. Blanco-Pastor JL, et al. PLoS One. 2012;7(6):e39089. doi: 10.1371/journal.pone.0039089. Epub 2012 Jun 29. PLoS One. 2012. PMID: 22768061 Free PMC article. - Quartet-based inference of cell differentiation trees from ChIP-Seq histone modification data.
Moumi NA, Das B, Tasnim Promi Z, Bristy NA, Bayzid MS. Moumi NA, et al. PLoS One. 2019 Sep 26;14(9):e0221270. doi: 10.1371/journal.pone.0221270. eCollection 2019. PLoS One. 2019. PMID: 31557185 Free PMC article. - Accurate gene-tree reconstruction by learning gene- and species-specific substitution rates across multiple complete genomes.
Rasmussen MD, Kellis M. Rasmussen MD, et al. Genome Res. 2007 Dec;17(12):1932-42. doi: 10.1101/gr.7105007. Epub 2007 Nov 7. Genome Res. 2007. PMID: 17989260 Free PMC article. - Rapid radiation in spiny lobsters (Palinurus spp) as revealed by classic and ABC methods using mtDNA and microsatellite data.
Palero F, Lopes J, Abelló P, Macpherson E, Pascual M, Beaumont MA. Palero F, et al. BMC Evol Biol. 2009 Nov 9;9:263. doi: 10.1186/1471-2148-9-263. BMC Evol Biol. 2009. PMID: 19900277 Free PMC article. - Integrating phylogenetic and population genetic analyses of multiple loci to test species divergence hypotheses in Passerina buntings.
Carling MD, Brumfield RT. Carling MD, et al. Genetics. 2008 Jan;178(1):363-77. doi: 10.1534/genetics.107.076422. Genetics. 2008. PMID: 18202379 Free PMC article.
References
- Nylander JA, Ronquist F, Huelsenbeck JP, Nieves-Aldrey JL. Syst Biol. 2004;53:47–67. - PubMed
- Felsenstein J. Inferring Phylogenies. Sunderland, MA: Sinauer; 2003.
- Huelsenbeck JP, Larget B, Miller RE, Ronquist F. Syst Biol. 2002;51:673–688. - PubMed
- Cracraft J, Donoghue MJ, editors. Assembling The Tree of Life. New York: Oxford Univ Press; 2004. pp. 468–489.
- Maddison WP. Syst Biol. 1997;46:523–536. - PubMed
Publication types
MeSH terms
Substances
LinkOut - more resources
Full Text Sources
Molecular Biology Databases


