Reduced TOR signaling extends chronological life span via increased respiration and upregulation of mitochondrial gene expression - PubMed (original) (raw)
Reduced TOR signaling extends chronological life span via increased respiration and upregulation of mitochondrial gene expression
Nicholas D Bonawitz et al. Cell Metab. 2007 Apr.
Abstract
The relationships between mitochondrial respiration, reactive oxygen species (ROS), and life span are complex and remain controversial. Inhibition of the target of rapamycin (TOR) signaling pathway extends life span in several model organisms. We show here that deletion of the TOR1 gene extends chronological life span in Saccharomyces cerevisiae, primarily by increasing mitochondrial respiration via enhanced translation of mtDNA-encoded oxidative phosphorylation complex subunits. Unlike previously reported pathways regulating chronological life span, we demonstrate that deletion of TOR1 delays aging independently of the antioxidant gene SOD2. Furthermore, wild-type and tor1 null strains differ in life span only when respiration competent and grown in normoxia in the presence of glucose. We propose that inhibition of TOR signaling causes derepression of respiration during growth in glucose and that the subsequent increase in mitochondrial oxygen consumption limits intracellular oxygen and ROS-mediated damage during glycolytic growth, leading to lower cellular ROS and extension of chronological life span.
Figures
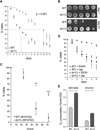
Figure 1. Deletion of TOR1 Extends Chronological Life Span and Increases Respiration in Two Different Yeast Strains
(A) Chronological life-span curves (i.e., % viability versus days in stationary phase) of wild-type (closed circles) and tor1 null cells (open circles) over two weeks, as assessed by staining with trypan blue. The curves shown were generated by compiling survival measurements from 11 different samples performed in 5 independent experiments. For clarity, we have marked the approximate median survival point of each curve with a dotted line. In this and all other figures, error bars represent standard deviation unless otherwise noted. (B) Serial 10-fold dilutions of stationary-phase cultures plated onto rich medium (YPD) at day 1 (upper panel) and day 21 (lower panel). (C) Chronological life-span measurements of wild-type and tor1 null derivatives of the short-lived strain BY4742 plotted as described in (A). *p < 0.05; **p < 0.005; ***p < 0.0005. (D) Chronological life-span curves of wild-type and tor1 null cells treated with 50 nM rapamycin or drug vehicle (ethanol). Survival was monitored by trypan blue staining. (E) Mitochondrial oxygen consumption of wild-type and tor1 null derivatives of strains DBY2006 (left) and BY4742 (right) at day 1 postinoculation in SD medium.
Figure 2. Deletion of TOR1 Fails to Extend Life Span in Petite Strains that Are Unable to Respire
Life-span curves of mitochondrial petite derivatives of wild-type and tor1 null strains due to inactivated mtDNA (A) or deletion of the COQ5 gene (B) plotted as described in Figure 1, except that time is reported in hours.
Figure 3. The Increased Respiration and Life-Span Phenotypes of tor1 Null Cells Are Glucose Dependent, and a Known Glucose-Repression Mutant, reg1, Phenocopies tor1 Null
(A) Mitochondrial oxygen consumption of wild-type and tor1 null cultures growing in glycerol medium before (left) and 4 hr after (right) addition of glucose (to 2%). Error bars in all panels of this figure represent the standard deviation of three replicates. (B) Chronological life-span curves of wild-type and tor1 null cells grown in glycerol medium. (C) As in (B), except that glucose was added (to 2%) at day 1. (D) Mitochondrial oxygen consumption of wild-type and tor1 null cells, graphed as a function of culture density (OD600). The points shown are the combination of three independent experiments, and each represents an individual oxygen consumption reading. (E) Oxygen consumption of reg1 null cells and their isogenic wild-type control (BY4741) at day 1. (F) Chronological life span measurements of the cultures described in (E) over three days in stationary phase.
Figure 4. Sod2p Is Upregulated Specifically in Stationary Phase in tor1 Null Cells and Contributes to Stress Resistance, but Not to Life-Span Extension
(A) Western blot analysis of Sod2p levels in wild-type and tor1 null cells at day 1 and day 2 of stationary phase. Shown at top is a pair of representative samples, and shown below is quantification of Sod2p relative to actin from three biological replicates. (B) ROS levels of wild-type and tor1 null cells at day 1 postinoculation, measured with the ROS-sensitive fluorescent dye dihydroethidium (DHE) and flow cytometry. The y axis shows the number of cells measured at a given point on the x axis, which is a logarithmic scale of arbitrary fluorescence units. The black line represents the fluorescence profile of the wild-type strain, and the filled gray curve represents that of the tor1 null strain. (C) Serial 10-fold dilutions of wild-type and tor1 null cells treated with the indicated levels of hydrogen peroxide (H2O2) at either day 1 or day 2 of stationary phase. (D) Life-span curves of sod2 mutants (closed squares), tor1 sod2 double mutants (closed circles), and tor1 sod2 double mutants transformed with a plasmid bearing wild-type SOD2 (open circles) compared to appropriate empty-vector control strains.
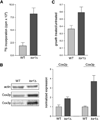
Figure 5. tor1 Null Cells Exhibit Increased Translation and Steady-State Levels of Mitochondrially Encoded Proteins
(A) Specific incorporation of 35S-labeled methionine into mtDNA-encoded OXPHOS subunits in wild-type and tor1 null strains (DBY2006 genetic background), plotted in millions of counts per minute (cpm × 106). (B) Western blot analysis of two mitochondrially encoded subunits of cytochrome c oxidase, Cox2p and Cox3p, at day 1 postinoculation. The left panel shows levels of actin (a loading control), Cox2p, and Cox3p in two representative samples, and the right panel shows quantification of Cox2p and Cox3p in three independent samples. For quantification, the ratio of actin:Cox2p or actin:Cox3p was determined for all samples and then normalized to the average wild-type ratio. (C) Chloramphenicol resistance of wild-type and tor1 null strains. Shown is the ratio for both wild-type and tor1 null cells of growth in glycerol medium containing 0.25 mg/ml chloramphenicol to growth in glycerol without chloramphenicol.
Figure 6. A Speculative Model Describing the Influence of TOR Signaling on Chronological Life Span through Effects on Mitochondrial Translation, Respiration, and ROS Production
Based on our results, TOR normally negatively influences mitochondrial gene expression by repressing mitochondrial translation and/or ribosome biogenesis (depicted as the number of mitochondrial ribosomes) during growth in glucose (A). While likely optimal for growth on glucose via glycolysis and subsequent fermentation, this has a deleterious effect on life span by promoting ROS production. We propose that this occurs because a less active electron transport chain (consisting of the OXPHOS complexes shown embedded in the inner mitochondrial membrane) first accumulates reduced and reactive redox components (shown as OXPHOS components with explosions) that can more readily transfer electrons (e−) to oxygen (O2; gray double circles) prior to complex IV to generate ROS (O2 molecules with explosions) instead of water (H2O; gray circles with black circles attached) and additionally allows more oxygen, the substrate for ROS, to accumulate in mitochondria. In other words, the electron transport chain becomes reduced and mitochondrial oxygen concentration rises, favoring ROS production and initiating the vicious cycle of mitochondrial and cellular damage that further reduces mitochondrial respiration and limits life span. In tor1 null cells (B), mitochondrial translation and/or ribosome biogenesis is derepressed, leading to a greater steady-state level of OXPHOS complexes in the inner mitochondrial membrane. This scenario is proposed to facilitate oxidization of the mitochondrial electron transport chain and keep intramitochondrial oxygen levels low, limiting ROS production and accumulation and delaying the onset of the life-span-limiting vicious cycle.
Comment in
- TOR and aging: less is more.
Schieke SM, Finkel T. Schieke SM, et al. Cell Metab. 2007 Apr;5(4):233-5. doi: 10.1016/j.cmet.2007.03.005. Cell Metab. 2007. PMID: 17403368
Similar articles
- Extension of chronological life span by reduced TOR signaling requires down-regulation of Sch9p and involves increased mitochondrial OXPHOS complex density.
Pan Y, Shadel GS. Pan Y, et al. Aging (Albany NY). 2009 Jan 28;1(1):131-45. doi: 10.18632/aging.100016. Aging (Albany NY). 2009. PMID: 20157595 Free PMC article. - Defective mitochondrial gene expression results in reactive oxygen species-mediated inhibition of respiration and reduction of yeast life span.
Bonawitz ND, Rodeheffer MS, Shadel GS. Bonawitz ND, et al. Mol Cell Biol. 2006 Jul;26(13):4818-29. doi: 10.1128/MCB.02360-05. Mol Cell Biol. 2006. PMID: 16782871 Free PMC article. - Regulation of yeast chronological life span by TORC1 via adaptive mitochondrial ROS signaling.
Pan Y, Schroeder EA, Ocampo A, Barrientos A, Shadel GS. Pan Y, et al. Cell Metab. 2011 Jun 8;13(6):668-78. doi: 10.1016/j.cmet.2011.03.018. Cell Metab. 2011. PMID: 21641548 Free PMC article. - Nutrient signaling through TOR kinases controls gene expression and cellular differentiation in fungi.
Rohde JR, Cardenas ME. Rohde JR, et al. Curr Top Microbiol Immunol. 2004;279:53-72. doi: 10.1007/978-3-642-18930-2_4. Curr Top Microbiol Immunol. 2004. PMID: 14560951 Review. - The chronological life span of Saccharomyces cerevisiae.
Fabrizio P, Longo VD. Fabrizio P, et al. Aging Cell. 2003 Apr;2(2):73-81. doi: 10.1046/j.1474-9728.2003.00033.x. Aging Cell. 2003. PMID: 12882320 Review.
Cited by
- Breathing lessons: Tor tackles the mitochondria.
Finkel T. Finkel T. Aging (Albany NY). 2009 Jan 16;1(1):9-11. doi: 10.18632/aging.100013. Aging (Albany NY). 2009. PMID: 20157592 Free PMC article. No abstract available. - A microarray-based genetic screen for yeast chronological aging factors.
Matecic M, Smith DL, Pan X, Maqani N, Bekiranov S, Boeke JD, Smith JS. Matecic M, et al. PLoS Genet. 2010 Apr 22;6(4):e1000921. doi: 10.1371/journal.pgen.1000921. PLoS Genet. 2010. PMID: 20421943 Free PMC article. - Neuronal expression of a single-subunit yeast NADH-ubiquinone oxidoreductase (Ndi1) extends Drosophila lifespan.
Bahadorani S, Cho J, Lo T, Contreras H, Lawal HO, Krantz DE, Bradley TJ, Walker DW. Bahadorani S, et al. Aging Cell. 2010 Apr;9(2):191-202. doi: 10.1111/j.1474-9726.2010.00546.x. Aging Cell. 2010. PMID: 20089120 Free PMC article. - Yeast Chronological Lifespan: Longevity Regulatory Genes and Mechanisms.
Mirisola MG, Longo VD. Mirisola MG, et al. Cells. 2022 May 23;11(10):1714. doi: 10.3390/cells11101714. Cells. 2022. PMID: 35626750 Free PMC article. Review. - Growth signaling promotes chronological aging in budding yeast by inducing superoxide anions that inhibit quiescence.
Weinberger M, Mesquita A, Caroll T, Marks L, Yang H, Zhang Z, Ludovico P, Burhans WC. Weinberger M, et al. Aging (Albany NY). 2010 Oct;2(10):709-26. doi: 10.18632/aging.100215. Aging (Albany NY). 2010. PMID: 21076178 Free PMC article.
References
- Balaban RS, Nemoto S, Finkel T. Mitochondria, oxidants, and aging. Cell. 2005;120:483–495. - PubMed
- Barja G. Mitochondrial oxygen radical generation and leak: sites of production in states 4 and 3, organ specificity, and relation to aging and longevity. J. Bioenerg. Biomembr. 1999;31:347–366. - PubMed
- Barros MH, Bandy B, Tahara EB, Kowaltowski AJ. Higher respiratory activity decreases mitochondrial reactive oxygen release and increases life span in Saccharomyces cerevisiae. J. Biol. Chem. 2004;279:49883–49888. - PubMed
- Bonawitz ND, Clayton DA, Shadel GS. Initiation and beyond: multiple functions of the human mitochondrial transcription machinery. Mol. Cell. 2006a;24:813–825. - PubMed
Publication types
MeSH terms
Substances
LinkOut - more resources
Full Text Sources
Other Literature Sources
Molecular Biology Databases


