Glucose mediates the translocation of NeuroD1 by O-linked glycosylation - PubMed (original) (raw)
Glucose mediates the translocation of NeuroD1 by O-linked glycosylation
Sreenath S Andrali et al. J Biol Chem. 2007.
Abstract
O-Linked GlcNAc modification of nuclear and cytosolic proteins has been shown to regulate the function of many cellular proteins. Increased O-linked glycosylation, observed under chronic hyperglycemia conditions, has been implicated in the pathogenesis of diabetes. However, the exact role of O-GlcNAc modification in regulating glucose homeostasis remains to be established. We report here that the subcellular localization of the pancreatic beta cell-specific transcription factor NeuroD1 is regulated by O-linked glycosylation in the mouse insulinoma cell line MIN6. Under low glucose conditions, NeuroD1 is mainly in the cytosol. However, treatment of MIN6 cells with high glucose results in O-linked GlcNAc modification of NeuroD1 and its subsequent translocation into the nucleus. Consistent with these data, treatment of MIN6 cells with O-(2-acetamido-2-deoxy-d-glucopyranosylidene)-amino N-phenylcarbamate, an inhibitor of O-GlcNAcase, causes Neuro-D1 localization to the nucleus and induction of insulin gene expression even on low glucose. Furthermore, we demonstrate that NeuroD1 interacts with the O-GlcNAc transferase, OGT only at high concentrations of glucose and depletion of OGT by using small interfering RNA oligos interferes with the nuclear localization of NeuroD1 on high glucose. On low glucose NeuroD1 interacts with the O-GlcNAcase and becomes deglycosylated, which is likely to be important for export of Neuro-D1 into cytosol in the presence of low glucose. In summary, the presented data suggest that glucose regulates the subcellular localization of NeuroD1 in pancreatic beta cells via O-linked GlcNAc modification of NeuroD1 by OGT.
Figures
Figure 1
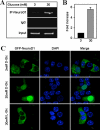
Exposure to high glucose increases NeuroD1 binding to the insulin promoter by causing the translocation of NeuroD1 from the cytosol into the nucleus. NeuroD1 binding to the insulin I promoter was analyzed by ChIP assay in MIN6 cells treated with either 3 or 30mM glucose using specific NeuroD1 antibodies. The immunoprecipitated DNA was amplified by PCR using primers against the insulin I promoter, separated on a non-denaturing PAGE gel and visualized by staining with ethidium bromide (Panel A). NeuroD1 binding to the insulin I promoter was quantified by real-time PCR and normalized to NeuroD1 binding activity on 3mM glucose (Panel B). Normal IgG was used as a negative control for immunoprecipitation. Panel C: MIN6 cells were transiently transfected with a GFP-NeuroD1 construct and treated with low (3mM D-Glc) or high (30mM D-Glc) D-glucose overnight. GFP-NeuroD1 was visualized by confocal microscopy. Cell nuclei were stained with DAPI. As a control, MIN6 cell were treated with 30mM L-glucose (30mM L-Glc).
Figure 2
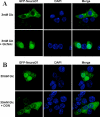
Increased flux via the hexosamine biosynthetic pathway regulates the translocation of NeuroD1 into nucleus in MIN6 cells. GFP-NeuroD1 transfected MIN6 cells were treated overnight with 3 mM glucose in the presence or absence of 2 mM glucosamine (GlcN) (Panel A) or 30 mM glucose with or without 20 μM 6-diazo-5-oxo-norleucine (DON) (Panel B) and GFP-NeuroD1 localization was visualized by fluorescence microscopy. Nuclei were stained with DAPI.
Figure 3
Inhibition of O-GlcNAcase by treatment with PUGNAc on low glucose causes NeuroD1 to localize to the nucleus and to bind to the insulin promoter. After transfection with the GFP-NeuroD1 construct, MIN6 cells were incubated with 3 mM glucose in the presence or absence of 100 μM PUGNAc and the localization of NeuroD1 was visualized by immunoflourescence microscopy (Panel A). Nuclear fractions obtained from MIN6 cells after treatment with 30 or 3 mM glucose with or without PUGNAc (100 μM) were resolved on 10% SDS-PAGE gel and immunoblotted with NeuroD1, histone H3 (nuclear marker) and thiolase (cytosolic marker) antibodies (Panel B). Panel C: ChIP analysis of NeuroD1 binding to the insulin I promoter was carried out in MIN6 cells treated with 30 or 3 mM glucose with or without PUGNAc (100 μM) using NeuroD1 antibodies or normal IgG (as negative control) for immunoprecipitation. The DNA extracted from the immunoprecipitates was used as template for PCR to amplify the insulin I gene promoter. 0.5% of the total DNA was used as input.
Figure 4
High glucose mediates the O-GlcNAc modification of NeuroD1 in MIN6 cells. Protein extracts from MIN6 cells incubated with 30 or 3 mM glucose with or without 100 μM PUGNAc were used for immunoprecipitation with the NeuroD1 specific antibody (IP-NeuroD1). Immunoprecipitates were resolved on 10% SDS-PAGE and immunoblotted with either CTD 110.6 (panel A) or RL2 (panel B) antibodies which specifically recognize O-GlcNAc modification on proteins. Normal IgG was used as negative control. The amount of NeuroD1 immunoprecipitated under various conditions as determined using the NeuroD1 antibodies is similar. Input represents 10% of the total cell lysate used for immunoprecipitation.
Figure 5
NeuroD1 interacts with OGT on high glucose and with O-GlcNAcase on low glucose incubated MIN6 cells. After incubation of MIN6 cells with 3 or 30 mM glucose, protein extracts were prepared and used for immunoprecipitation assays with OGT (panel A) or O-GlcNAcase (panel B) antibodies. Immunoprecipitates were resolved on 10% SDS-PAGE and immunoblotted with NeuroD1 antibodies. The amount of OGT (panel A, IB:OGT) and O-GlcNAcase (panel B, IB:O-GlcNAcase) protein immunoprecipitated from 3 or 30mM glucose incubated cell extracts was similar. Normal IgG was used as a negative control and 10% of the cell lysate used for immunoprecipitation was loaded as input.
Figure 6
Silencing of OGT expression using siRNA oligos, blocks the nuclear localization of NeuroD1 on high glucose. MIN6 cells were co-transfected with the GFP-NeuroD1 construct and siRNA oligos against OGT (si-OGT) or as a negative control with random siRNA oligos (si-Random). OGT protein was detected in cells by incubation with an OGT antibody and a secondary antibody conjugated to Alexa Fluor 594. OGT staining and GFP-NeuroD1 was visualized by confocal microscopy. Nuclei were stained with DAPI.
Figure 7
Treatment with PUGNAc in the presence of low glucose increases insulin gene transcription. MIN6 cells incubated with 30mM or 3mM glucose with or without 100μM PUGNAc were used for isolation of total RNA. The levels of insulin I and beta-actin mRNA were quantified using real-time RT-PCR in three independent experiments (n=3). The graph represents the fold changes in insulin I mRNA levels compared to 3mM glucose incubated MIN6 cells and is normalized for beta-actin levels. * p <0.01 and ** p<0.03.
Similar articles
- O-Linked β-N-acetylglucosamine (O-GlcNAc) Acts as a Glucose Sensor to Epigenetically Regulate the Insulin Gene in Pancreatic Beta Cells.
Durning SP, Flanagan-Steet H, Prasad N, Wells L. Durning SP, et al. J Biol Chem. 2016 Jan 29;291(5):2107-18. doi: 10.1074/jbc.M115.693580. Epub 2015 Nov 23. J Biol Chem. 2016. PMID: 26598517 Free PMC article. - E. coli sabotages the in vivo production of O-linked β-N-acetylglucosamine-modified proteins.
Goodwin OY, Thomasson MS, Lin AJ, Sweeney MM, Macnaughtan MA. Goodwin OY, et al. J Biotechnol. 2013 Dec;168(4):315-23. doi: 10.1016/j.jbiotec.2013.10.008. Epub 2013 Oct 16. J Biotechnol. 2013. PMID: 24140293 - Glucose induces MafA expression in pancreatic beta cell lines via the hexosamine biosynthetic pathway.
Vanderford NL, Andrali SS, Ozcan S. Vanderford NL, et al. J Biol Chem. 2007 Jan 19;282(3):1577-84. doi: 10.1074/jbc.M605064200. Epub 2006 Dec 1. J Biol Chem. 2007. PMID: 17142462 Free PMC article. - The role of O-linked protein glycosylation in beta-cell dysfunction.
Konrad RJ, Kudlow JE. Konrad RJ, et al. Int J Mol Med. 2002 Nov;10(5):535-9. Int J Mol Med. 2002. PMID: 12373287 Review. - O-GlcNAc turns twenty: functional implications for post-translational modification of nuclear and cytosolic proteins with a sugar.
Wells L, Hart GW. Wells L, et al. FEBS Lett. 2003 Jul 3;546(1):154-8. doi: 10.1016/s0014-5793(03)00641-0. FEBS Lett. 2003. PMID: 12829252 Review.
Cited by
- O-GlcNAc protein modification in cancer cells increases in response to glucose deprivation through glycogen degradation.
Kang JG, Park SY, Ji S, Jang I, Park S, Kim HS, Kim SM, Yook JI, Park YI, Roth J, Cho JW. Kang JG, et al. J Biol Chem. 2009 Dec 11;284(50):34777-84. doi: 10.1074/jbc.M109.026351. Epub 2009 Oct 15. J Biol Chem. 2009. PMID: 19833729 Free PMC article. - Role of nutrient-driven O-GlcNAc-post-translational modification in pancreatic exocrine and endocrine islet development.
Baumann D, Wong A, Akhaphong B, Jo S, Pritchard S, Mohan R, Chung G, Zhang Y, Alejandro EU. Baumann D, et al. Development. 2020 Apr 12;147(7):dev186643. doi: 10.1242/dev.186643. Development. 2020. PMID: 32165492 Free PMC article. - Identification of glucose-regulated miRNAs from pancreatic {beta} cells reveals a role for miR-30d in insulin transcription.
Tang X, Muniappan L, Tang G, Ozcan S. Tang X, et al. RNA. 2009 Feb;15(2):287-93. doi: 10.1261/rna.1211209. Epub 2008 Dec 18. RNA. 2009. PMID: 19096044 Free PMC article. - Major miRNA Involved in Insulin Secretion and Production in Beta-Cells.
Aghaei M, Khodadadian A, Elham KN, Nazari M, Babakhanzadeh E. Aghaei M, et al. Int J Gen Med. 2020 Mar 10;13:89-97. doi: 10.2147/IJGM.S249011. eCollection 2020. Int J Gen Med. 2020. PMID: 32210605 Free PMC article. Review. - A homozygous missense mutation in NEUROD1 is associated with nonsyndromic autosomal recessive retinitis pigmentosa.
Wang F, Li H, Xu M, Li H, Zhao L, Yang L, Zaneveld JE, Wang K, Li Y, Sui R, Chen R. Wang F, et al. Invest Ophthalmol Vis Sci. 2014 Dec 4;56(1):150-5. doi: 10.1167/iovs.14-15382. Invest Ophthalmol Vis Sci. 2014. PMID: 25477324 Free PMC article.
References
- Permutt MA, Kipnis DM. J. Biol. Chem. 1972;247:1194–1199. - PubMed
- Docherty K, Clark AR. FASEB J. 1994;8:20–27. - PubMed
- Melloul D, Marshak S, Cerasi E. Diabetologia. 2002;45:309–326. - PubMed
- Hui H, Perfetti R. Eur. J. Endocrinol. 2002;146:129–141. - PubMed
- Naya FJ, Stellrecht CM, Tsai MJ. Genes Dev. 1995;15:1009–1019. - PubMed
Publication types
MeSH terms
Substances
Grants and funding
- R21 DK065730/DK/NIDDK NIH HHS/United States
- P20 RR020171/RR/NCRR NIH HHS/United States
- R01 DK067581-02/DK/NIDDK NIH HHS/United States
- P20RR20171/RR/NCRR NIH HHS/United States
- R01 DK067581/DK/NIDDK NIH HHS/United States
- R21 DK065730-02/DK/NIDDK NIH HHS/United States
LinkOut - more resources
Full Text Sources
Other Literature Sources
Molecular Biology Databases
Miscellaneous


