Temporal dynamics and linkage disequilibrium in natural Caenorhabditis elegans populations - PubMed (original) (raw)
Temporal dynamics and linkage disequilibrium in natural Caenorhabditis elegans populations
Antoine Barrière et al. Genetics. 2007 Jun.
Abstract
Caenorhabditis elegans is a major laboratory model system yet a newcomer to the field of population genetics, and relatively little is known of its biology in the wild. Recent studies of natural populations at a single time point revealed strong spatial population structure and suggested that these populations may be very dynamic. We have therefore studied several natural C. elegans populations over time and genotyped them at polymorphic microsatellite loci. While some populations appear to be genetically stable over the course of observation, others seem to go extinct, with full replacement of multilocus genotypes upon regrowth. The frequency of heterozygotes indicates that outcrossing occurs at a mean frequency of 1.7% and is variable between populations. However, in genetically stable populations, linkage disequilibrium between different chromosomes can be maintained over several years at a level much higher than expected from the heterozygote frequency. C. elegans seems to follow metapopulation dynamics, and the maintenance of linkage disequilibrium despite a low yet significant level of outcrossing suggests that selection may act against the progeny of outcrossings.
Figures
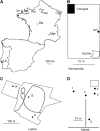
Figure 1.—
Sampling locations. (A) Map of sampling locations in mainland France and Portugal. (B) Sketch of the Hermanville sampling location. (C) Sketch of the Lisbon sampling location. (D) Sketch of the Merlet sampling location. Scales are indicated for each map.
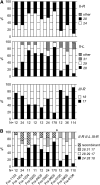
Figure 2.—
Temporal survey of allele and multilocus genotype frequencies in the Franconville population. (A) Allele frequencies at loci II-R, II-L, and III-R (the most polymorphic loci in this population) over time in the Franconville population. The repeat number is indicated for each locus on the right. The number of genotyped individuals (N) is indicated below each time point (horizontal axis). (B) Frequencies of multilocus genotypes for the major alleles at the same three loci. Individuals showing a recombination between the major genotypes are indicated as recombinants. Rare haplotypes (<2% when considering all time points) were removed from this analysis. For more detailed data, see supplemental Figure S2G at
http://www.genetics.org/supplemental/
.
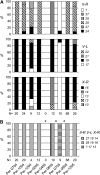
Figure 3.—
Temporal survey of allele and multilocus genotype frequencies in the Le Perreux-sur-Marne population. (A) Allele frequencies at loci II-R, V-L, and X-R in the Le Perreux population, displayed as in Figure 2. For locus II-R in sample Per-0705, amplification repeatedly failed for several individuals (indicated as “?”). (B) Frequencies of multilocus genotypes for the major alleles at three loci in Le Perreux. No evidence of recombination between the three major genotypes was found. Rare haplotypes (<2% when considering all time points) were removed. Asterisks indicate significant differentiation between consecutive samples. For more detailed data, see supplemental Figure S2F at
http://www.genetics.org/supplemental/
.
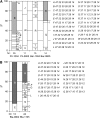
Figure 4.—
Multilocus genotypes in the Primel/Sainte-Barbe and Le Blanc populations at two time points. (A) Haplotype frequencies in Primel (Pri) and Sainte-Barbe (Bar) in October 2004 and August 2005. N, number of genotyped individuals. Haplotypes are identified by their alleles (number of repeat) at each locus in the following order: II-R, V-L, II-L, III-R, IV-L, and X-R. Each haplotype is identified by a letter code common to both locations (PriBarA–X); haplotype PriBar-B (light shading) is found in both Pri-1004 and Bar-0805 samples. (B) Haplotype frequencies in Le Blanc in 2002 and 2005. Each haplotype is identified by a letter code (BlaA–Q). Haplotype Bla-B (dark shading) was found on both dates.
Figure 5.—
Evolution of linkage disequilibrium over time in the Franconville population. Linkage disequilibrium _D_′ was measured at different time points. Error bars delimit the 95% confidence interval.
Similar articles
- High local genetic diversity and low outcrossing rate in Caenorhabditis elegans natural populations.
Barrière A, Félix MA. Barrière A, et al. Curr Biol. 2005 Jul 12;15(13):1176-84. doi: 10.1016/j.cub.2005.06.022. Curr Biol. 2005. PMID: 16005289 - Outcrossing and the maintenance of males within C. elegans populations.
Anderson JL, Morran LT, Phillips PC. Anderson JL, et al. J Hered. 2010 Mar-Apr;101 Suppl 1(Suppl 1):S62-74. doi: 10.1093/jhered/esq003. Epub 2010 Mar 8. J Hered. 2010. PMID: 20212008 Free PMC article. - Sampling from natural populations with RNAI reveals high outcrossing and population structure in Caenorhabditis elegans.
Sivasundar A, Hey J. Sivasundar A, et al. Curr Biol. 2005 Sep 6;15(17):1598-602. doi: 10.1016/j.cub.2005.08.034. Curr Biol. 2005. PMID: 16139217 - Natural variation and population genetics of Caenorhabditis elegans.
Barrière A, Félix MA. Barrière A, et al. WormBook. 2005 Dec 26:1-19. doi: 10.1895/wormbook.1.43.1. WormBook. 2005. PMID: 18050391 Free PMC article. Review. - Caenorhabditis elegans as a platform for molecular quantitative genetics and the systems biology of natural variation.
Gaertner BE, Phillips PC. Gaertner BE, et al. Genet Res (Camb). 2010 Dec;92(5-6):331-48. doi: 10.1017/S0016672310000601. Genet Res (Camb). 2010. PMID: 21429266 Review.
Cited by
- Natural variation in fecundity is correlated with species-wide levels of divergence in Caenorhabditis elegans.
Zhang G, Mostad JD, Andersen EC. Zhang G, et al. G3 (Bethesda). 2021 Aug 7;11(8):jkab168. doi: 10.1093/g3journal/jkab168. G3 (Bethesda). 2021. PMID: 33983439 Free PMC article. - Mos1-mediated transgenesis to probe consequences of single gene mutations in variation-rich isolates of Caenorhabditis elegans.
Tarailo-Graovac M, Chen N. Tarailo-Graovac M, et al. PLoS One. 2012;7(11):e48762. doi: 10.1371/journal.pone.0048762. Epub 2012 Nov 14. PLoS One. 2012. PMID: 23155404 Free PMC article. - Clostridium butyricum MIYAIRI 588 Increases the Lifespan and Multiple-Stress Resistance of Caenorhabditis elegans.
Kato M, Hamazaki Y, Sun S, Nishikawa Y, Kage-Nakadai E. Kato M, et al. Nutrients. 2018 Dec 5;10(12):1921. doi: 10.3390/nu10121921. Nutrients. 2018. PMID: 30563064 Free PMC article. - Genome-wide variations in a natural isolate of the nematode Caenorhabditis elegans.
Vergara IA, Tarailo-Graovac M, Frech C, Wang J, Qin Z, Zhang T, She R, Chu JS, Wang K, Chen N. Vergara IA, et al. BMC Genomics. 2014 Apr 2;15:255. doi: 10.1186/1471-2164-15-255. BMC Genomics. 2014. PMID: 24694239 Free PMC article. - Experience Modulates the Reproductive Response to Heat Stress in C. elegans via Multiple Physiological Processes.
Gouvêa DY, Aprison EZ, Ruvinsky I. Gouvêa DY, et al. PLoS One. 2015 Dec 29;10(12):e0145925. doi: 10.1371/journal.pone.0145925. eCollection 2015. PLoS One. 2015. PMID: 26713620 Free PMC article.
References
- Agrawal, A. F., 2006. Evolution of sex: Why do organisms shuffle their genotypes? Curr. Biol. 16 R696–R704. - PubMed
- Barrière, A., and M.-A. Félix, 2005. High local genetic diversity and low outcrossing rate in Caenorhabditis elegans natural populations. Curr. Biol. 15 1176–1184. - PubMed
- Barrière, A., and M.-A. Félix, 2006. Isolation of C. elegans and related nematodes in WormBook, edited by The C. elegans Research Community (http://www.wormbook.org/). - PMC - PubMed
- Charbonnel, N., and J. Pemberton, 2005. A long-term genetic survey of an ungulate population reveals balancing selection acting on MHC through spatial and temporal fluctuations in selection. Heredity 95 377–388. - PubMed


