Systematic colocalization errors between acridine orange and EGFP in astrocyte vesicular organelles - PubMed (original) (raw)
Systematic colocalization errors between acridine orange and EGFP in astrocyte vesicular organelles
Fabien Nadrigny et al. Biophys J. 2007.
Abstract
Dual-color imaging of acridine orange (AO) and EGFP fused to a vesicular glutamate transporter or the vesicle-associated membrane proteins 2 or 3 has been used to visualize a supposedly well-defined subpopulation of glutamatergic astrocytic secretory vesicles undergoing regulated exocytosis. However, AO metachromasy results in the concomitant emission of green and red fluorescence from AO-stained tissue. Therefore, the question arises whether AO and EGFP fluorescence can be distinguished reliably. We used evanescent-field imaging with spectral fluorescence detection as well as fluorescence lifetime imaging microscopy to demonstrate that green fluorescent AO monomers inevitably coexist with red fluorescing AO dimers, at the level of single astroglial vesicles. The green monomer emission spectrally overlaps with that of EGFP and produces a false apparent colocalization on dual-color images. On fluorophore abundance maps calculated from spectrally resolved and unmixed single-vesicle spectral image stacks, EGFP is obscured by the strong green monomer fluorescence, precluding the detection of EGFP. Hence, extreme caution is required when deriving quantitative colocalization information from images of dim fluorescing EGFP-tagged organelles colabeled with bright and broadly emitting dyes like AO. We finally introduce FM4-64/EGFP dual-color imaging as a remedy for imaging a distinct population of astroglial fusion-competent secretory vesicles.
Figures
FIGURE 1
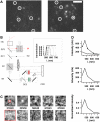
Principle of acridine orange (AO)/EGFP detection with dual-band fluorescence or single-secretory organelle spectral imaging and linear unmixing. (A) 488-nm excited total-internal reflection fluorescence (TIRF) image of an AO-loaded (5 _μ_M) astrocyte after 15-min incubation at 37°C, viewed through a dual-view emission beam-splitter (535 ± 25-nm band-pass, 590 nm dichroic mirror, and 600 nm long-pass filter). Circles show spots that are visible in both the red and green detection channel. Scale bar is 5 _μ_m. (B) Schematic microscope optical path for combined TIRF and epifluorescence. The beam angle and hence the penetration depth of the evanescent field is set by sliding the TIRF condenser (shaded) relative to the optical axis. A motorized filter wheel and dual-viewer device (boxed) permit sequential multispectral or (simultaneous) dual-color recordings, respectively. Obj, 1.45NA-×60 objective; DC1, DC3, 500DCLP dichroic mirrors; M1, (100%) mirror; and DC2, 590DCLP secondary dichroic mirror. (Inset) Transmission spectra of the band-pass filters used for spectral unmixing. (C) Epifluorescence spectral images of a VAMP2-EGFP expressing astroglial vesicle (top) and spectral background images, taken in a cell-free region (bottom). (D, top) Raw-data experimental organelle (solid) and background spectra (open circles) for the regions shown in red on panel C. Background-subtracted organelle spectrum before (middle) and after normalization (bottom).
FIGURE 2
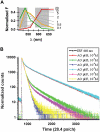
Acridine orange (AO) metachromasy. (A) Concentration dependence of the five-point emission spectrum (510 ± 10, 535 ± 25, 560 ± 20, 615 ± 22.5, and 670 ± 20 nm) of aqueous AO solutions (gray traces, [AO] in mM).The spectral emission of EGFP expressed in the cytoplasm of cortical astrocytes is shown in green for comparison. The mixed AO spectrum depends on the relative abundance of green fluorescent m.AO and red fluorescent d.AO, which depends on [AO]. Measured AO spectra (gray) converged toward pure m.AO (yellow) or d.AO reference spectra (red) at low and high concentrations, respectively. (B) In vitro picosecond fluorescence lifetime imaging microscopy (FLIM) of AO corroborated the steady-state fluorescence measurements shown in panel A. The observed ps time-dependent fluorescence displayed a multiexponential decay with two principal components, _τ_1 = 1.85 ns and _τ_2 = 18 ns. IRF, instrument response function. Table 1 summarizes their relative amplitudes as a function of [AO]. Differences to 100% are due to minor components with _τ_3 = 5 and _τ_4 = 11 ns with a relative amplitude <7%.
FIGURE 3
Astroglial autofluorescence interferes with the detection of monomeric AO (m.AO). (A) Spectral imaging of pure control samples and subsequent linear unmixing with reference spectra of m.AO, dimeric AO (d.AO), and EGFP correctly detects pure fluorescent species. (B) Astroglial autofluorescence (AF) interferes with m.AO detection (C), due to the virtually identical spectral profile of the AF and AO emission.
FIGURE 4
Single vesicle spectral unmixing of astrocytes after AO loading. Examples of normalized emission spectra of astroglial vesicular organelles, after loading with 5 _μ_M AO, 15 min at 23°C (A), and at 37°C (B), respectively. Although extracted from an Airy-sized region of interest centered on the organelle, these spectra may contain signals from the organelles from above and below focus. To unambiguously detect the presence of monomeric (m.AO) or dimeric AO (d.AO), we used a statistical test that compares the organelle spectrum with its (peripheral) background. Green and red color-code for organelles on which m.AO or d.AO only were detected; yellow indicates the detection of both, i.e., colocalization on the same organelle. (C) Detection of m.AO and d.AO in single organelles. Each barbell represents one organelle. Their extremities give the result of the detection test for the presence of m.AO and d.AO, respectively. The dashed line indicates the threshold level corresponding to 95% certainty for detecting fluorophore presence in the studied spot. Green barbells symbolize organelles that exclusively contain m.AO; red, only d.AO; and yellow stands for organelles in which both the presence of m.AO and d.AO was detected (see Table 2). Error bars are confidence intervals defined for 70% certainty.
FIGURE 5
AO obscures the EGFP signal on spectral images. (A) Examples of normalized mixed organelle spectra extracted from a VAMP2-EGFP expressing astrocyte before (top) and after (bottom) AO labeling (5 _μ_M, 15 min, 23°). Note the variable degree of red hue. Reconstituted fluorophore abundance maps (left, and confidence interval of the SILU estimate, right, see Materials and Methods) before (B) and after AO loading (C). EGFP, but not acridine orange monomers (m.AO) or dimers (d.AO), were detected before AO labeling. After AO accumulation in the vesicle lumen, the EGFP signal is totally obscured by the bright m.AO and d.AO fluorescence. Units are numbers of pure spectra of EGFP, m.AO, and d.AO, respectively. Exposure times were 100 ms before and 10 ms after AO loading, respectively. Scale bar is 1 _μ_m. The hole in the postloading EGFP image is due to the absence of a nonnegativity constraint on the abundance coefficients. (D) Log-intensity histogram of green fluorescence (TIRF 488 nm, HQ535/50m) of near-membrane organelles expressing VAMP2-EGFP (open bars), or labeled with AO during 15 min, with 5 _μ_M [AO] at 23°C (gray) or 37°C (red). Graph pools data from 35 cells.
FIGURE 6
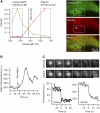
VAMP3-EGFP/FM4-64 dual-color imaging of astroglial secretory vesicle fusion. (A) (Left) Experimental single-organelle fluorescence emission spectrum of VAMP2-EGFP and FM4-64 double-labeled astroglial vesicles (n = 8, mean ± SD) are virtually free of emission cross-talk. Detection bands are indicated by rectangles. (Right) Dual-viewer 488-nm excited epifluorescence images of an EGFP/FM4-64 double-labeled astrocyte and their pseudo-color merge (bottom). (B) Raw-data fluorescence of the calcium indicator Oregon Green-BAPTA-1-AM (OGB-1, 2 _μ_M, 40 min) in response to mechanical stimulation. Brief ejection of physiological saline from a local perfusion pipette generated recurrent and reversible calcium ([Ca2+]i) transients. (C) Concomitant loss of VAMP3-EGFP and FM4-64 fluorescence upon exocytosis of the doubly-labeled vesicle identified on panel A, arrow. Note the slower destaining kinetics for cellubrevin-EGFP relative to FM4-64. The value t = 0 represents the onset of fusion, defined as the first point where the FM4-64 signal dropped below the pre-destaining average intensity minus three times its standard deviation. The organelle shown fused with a lag of 10 s after mechanical stimulation.
Similar articles
- Real-time imaging of exocytotic mucin release and swelling in Calu-3 cells using acridine orange.
Shumilov D, Popov A, Fudala R, Akopova I, Gryczynski I, Borejdo J, Gryczynski Z, Grygorczyk R. Shumilov D, et al. Methods. 2014 Mar 15;66(2):312-24. doi: 10.1016/j.ymeth.2013.09.004. Epub 2013 Sep 18. Methods. 2014. PMID: 24055436 Free PMC article. - Simultaneous evanescent wave imaging of insulin vesicle membrane and cargo during a single exocytotic event.
Tsuboi T, Zhao C, Terakawa S, Rutter GA. Tsuboi T, et al. Curr Biol. 2000 Oct 19;10(20):1307-10. doi: 10.1016/s0960-9822(00)00756-9. Curr Biol. 2000. PMID: 11069115 - A confocal study on the visualization of chromaffin cell secretory vesicles with fluorescent targeted probes and acidic dyes.
Moreno A, SantoDomingo J, Fonteriz RI, Lobatón CD, Montero M, Alvarez J. Moreno A, et al. J Struct Biol. 2010 Dec;172(3):261-9. doi: 10.1016/j.jsb.2010.06.015. Epub 2010 Jun 22. J Struct Biol. 2010. PMID: 20600953 - Characterization of acidic vesicles in multidrug-resistant and sensitive cancer cells by acridine orange staining and confocal microspectrofluorometry.
Millot C, Millot JM, Morjani H, Desplaces A, Manfait M. Millot C, et al. J Histochem Cytochem. 1997 Sep;45(9):1255-64. doi: 10.1177/002215549704500909. J Histochem Cytochem. 1997. PMID: 9283613 - Evanescent-wave microscopy: a new tool to gain insight into the control of transmitter release.
Oheim M, Loerke D, Chow RH, Stühmer W. Oheim M, et al. Philos Trans R Soc Lond B Biol Sci. 1999 Feb 28;354(1381):307-18. doi: 10.1098/rstb.1999.0382. Philos Trans R Soc Lond B Biol Sci. 1999. PMID: 10212479 Free PMC article. Review.
Cited by
- Morphological changes of telocytes in camel efferent ductules in response to seasonal variations during the reproductive cycle.
Abdel-Maksoud FM, Abd-Elhafeez HH, Soliman SA. Abdel-Maksoud FM, et al. Sci Rep. 2019 Mar 14;9(1):4507. doi: 10.1038/s41598-019-41143-y. Sci Rep. 2019. PMID: 30872789 Free PMC article. - A Light-Sheet-Based Imaaging Spectrometer to Characterize Acridine Orange Fluorescence within Leukocytes.
Powless AJ, Prieto SP, Gramling MR, Chen J, Muldoon TJ. Powless AJ, et al. Diagnostics (Basel). 2020 Dec 12;10(12):1082. doi: 10.3390/diagnostics10121082. Diagnostics (Basel). 2020. PMID: 33322812 Free PMC article. - Morphological and immunohistochemical phenotype of TCs in the intestinal bulb of Grass carp and their potential role in intestinal immunity.
Abd-Elhafeez HH, Abou-Elhamd AS, Soliman SA. Abd-Elhafeez HH, et al. Sci Rep. 2020 Aug 20;10(1):14039. doi: 10.1038/s41598-020-70032-y. Sci Rep. 2020. PMID: 32820212 Free PMC article. - Astrocytes respond to a neurotoxic Aβ fragment with state-dependent Ca2+ alteration and multiphasic transmitter release.
Pham C, Hérault K, Oheim M, Maldera S, Vialou V, Cauli B, Li D. Pham C, et al. Acta Neuropathol Commun. 2021 Mar 16;9(1):44. doi: 10.1186/s40478-021-01146-1. Acta Neuropathol Commun. 2021. PMID: 33726852 Free PMC article. - Fast subplasma membrane Ca2+ transients control exo-endocytosis of synaptic-like microvesicles in astrocytes.
Marchaland J, Calì C, Voglmaier SM, Li H, Regazzi R, Edwards RH, Bezzi P. Marchaland J, et al. J Neurosci. 2008 Sep 10;28(37):9122-32. doi: 10.1523/JNEUROSCI.0040-08.2008. J Neurosci. 2008. PMID: 18784293 Free PMC article.
References
- Garcia Peñarrubia, P., X. Férez Ruiz, and J. Galvez. 2005. Quantitative analysis of the factors that affect the determination of colocalization coefficients in dual-color confocal images. IEEE Trans. Image Proc. 14:1–8. - PubMed
- Oheim, M., and D. Li. 2007. Quantitative colocalization imaging: concepts, measurements and pitfalls. In Imaging Cellular and Molecular Biological Function. F. Frischknecht, J. B. Pawley, and S. Shorte, editors. Springer, Heidelberg, Berlin.
- Chieregatti, E., and J. Meldolesi. 2005. Regulated exocytosis: new organelles for non-secretory purposes. Nat. Rev. Mol. Cell Biol. 6:181–187. - PubMed
- Borgonovo, B., E. Cocucci, G. Racchetti, P. Podini, A. Bachi, and J. Meldolesi. 2002. Regulated exocytosis: a novel, widely expressed system. Nat. Cell Biol. 4:955–963. - PubMed
Publication types
MeSH terms
Substances
LinkOut - more resources
Full Text Sources
Other Literature Sources


