Error bars in experimental biology - PubMed (original) (raw)
Error bars in experimental biology
Geoff Cumming et al. J Cell Biol. 2007.
Abstract
Error bars commonly appear in figures in publications, but experimental biologists are often unsure how they should be used and interpreted. In this article we illustrate some basic features of error bars and explain how they can help communicate data and assist correct interpretation. Error bars may show confidence intervals, standard errors, standard deviations, or other quantities. Different types of error bars give quite different information, and so figure legends must make clear what error bars represent. We suggest eight simple rules to assist with effective use and interpretation of error bars.
Figures
Figure 1.
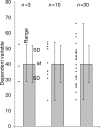
Descriptive error bars. Means with error bars for three cases: n = 3, n = 10, and n = 30. The small black dots are data points, and the column denotes the data mean M. The bars on the left of each column show range, and the bars on the right show standard deviation (SD). M and SD are the same for every case, but notice how much the range increases with n. Note also that although the range error bars encompass all of the experimental results, they do not necessarily cover all the results that could possibly occur. SD error bars include about two thirds of the sample, and 2 x SD error bars would encompass roughly 95% of the sample.
Figure 2.
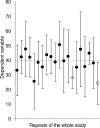
Confidence intervals. Means and 95% CIs for 20 independent sets of results, each of size n = 10, from a population with mean μ = 40 (marked by the dotted line). In the long run we expect 95% of such CIs to capture μ; here 18 do so (large black dots) and 2 do not (open circles). Successive CIs vary considerably, not only in position relative to μ, but also in length. The variation from CI to CI would be less for larger sets of results, for example n = 30 or more, but variation in position and in CI length would be even greater for smaller samples, for example n = 3.
Figure 3.
Inappropriate use of error bars. Enzyme activity for MEFs showing mean + SD from duplicate samples from one of three representative experiments. Values for wild-type vs. −/− MEFs were significant for enzyme activity at the 3-h timepoint (P < 0.0005). This figure and its legend are typical, but illustrate inappropriate and misleading use of statistics because n = 1. The very low variation of the duplicate samples implies consistency of pipetting, but says nothing about whether the differences between the wild-type and −/− MEFs are reproducible. In this case, the means and errors of the three experiments should have been shown.
Figure 4.
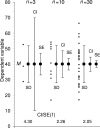
Inferential error bars. Means with SE and 95% CI error bars for three cases, ranging in size from n = 3 to n = 30, with descriptive SD bars shown for comparison. The small black dots are data points, and the large dots indicate the data mean M. For each case the error bars on the left show SD, those in the middle show 95% CI, and those on the right show SE. Note that SD does not change, whereas the SE bars and CI both decrease as n gets larger. The ratio of CI to SE is the t statistic for that n, and changes with n. Values of t are shown at the bottom. For each case, we can be 95% confident that the 95% CI includes μ, the true mean. The likelihood that the SE bars capture μ varies depending on n, and is lower for n = 3 (for such low values of n, it is better to simply plot the data points rather than showing error bars, as we have done here for illustrative purposes).
Figure 5.
Estimating statistical significance using the overlap rule for SE bars. Here, SE bars are shown on two separate means, for control results C and experimental results E, when n is 3 (left) or n is 10 or more (right). “Gap” refers to the number of error bar arms that would fit between the bottom of the error bars on the controls and the top of the bars on the experimental results; i.e., a gap of 2 means the distance between the C and E error bars is equal to twice the average of the SEs for the two samples. When n = 3, and double the length of the SE error bars just touch (i.e., the gap is 2 SEs), P is ∼0.05 (we don't recommend using error bars where n = 3 or some other very small value, but we include rules to help the reader interpret such figures, which are common in experimental biology).
Figure 6.
Estimating statistical significance using the overlap rule for 95% CI bars. Here, 95% CI bars are shown on two separate means, for control results C and experimental results E, when n is 3 (left) or n is 10 or more (right). “Overlap” refers to the fraction of the average CI error bar arm, i.e., the average of the control (C) and experimental (E) arms. When n ≥ 10, if CI error bars overlap by half the average arm length, P ≈ 0.05. If the tips of the error bars just touch, P ≈ 0.01.
Figure 7.
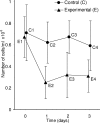
Inferences between and within groups. Means and SE bars are shown for an experiment where the number of cells in three independent clonal experimental cell cultures (E) and three independent clonal control cell cultures (C) was measured over time. Error bars can be used to assess differences between groups at the same time point, for example by using an overlap rule to estimate P for E1 vs. C1, or E3 vs. C3; but the error bars shown here cannot be used to assess within group comparisons, for example the change from E1 to E2.
Similar articles
- Researchers misunderstand confidence intervals and standard error bars.
Belia S, Fidler F, Williams J, Cumming G. Belia S, et al. Psychol Methods. 2005 Dec;10(4):389-96. doi: 10.1037/1082-989X.10.4.389. Psychol Methods. 2005. PMID: 16392994 - Evaluating concentration estimation errors in ELISA microarray experiments.
Daly DS, White AM, Varnum SM, Anderson KK, Zangar RC. Daly DS, et al. BMC Bioinformatics. 2005 Jan 26;6:17. doi: 10.1186/1471-2105-6-17. BMC Bioinformatics. 2005. PMID: 15673468 Free PMC article. - Explorations in statistics: standard deviations and standard errors.
Curran-Everett D. Curran-Everett D. Adv Physiol Educ. 2008 Sep;32(3):203-8. doi: 10.1152/advan.90123.2008. Adv Physiol Educ. 2008. PMID: 18794241 Review. - Maintaining standards: differences between the standard deviation and standard error, and when to use each.
Streiner DL. Streiner DL. Can J Psychiatry. 1996 Oct;41(8):498-502. doi: 10.1177/070674379604100805. Can J Psychiatry. 1996. PMID: 8899234 - Evaluation of instrument error and method agreement.
Chatburn RL. Chatburn RL. AANA J. 1996 Jun;64(3):261-8. AANA J. 1996. PMID: 9095698 Review.
Cited by
- Natural variation identifies multiple loci controlling petal shape and size in Arabidopsis thaliana.
Abraham MC, Metheetrairut C, Irish VF. Abraham MC, et al. PLoS One. 2013;8(2):e56743. doi: 10.1371/journal.pone.0056743. Epub 2013 Feb 13. PLoS One. 2013. PMID: 23418598 Free PMC article. - RNA sequencing of long-term label-retaining colon cancer stem cells identifies novel regulators of quiescence.
Regan JL, Schumacher D, Staudte S, Steffen A, Lesche R, Toedling J, Jourdan T, Haybaeck J, Mumberg D, Henderson D, Győrffy B, Regenbrecht CRA, Keilholz U, Schäfer R, Lange M. Regan JL, et al. iScience. 2021 May 24;24(6):102618. doi: 10.1016/j.isci.2021.102618. eCollection 2021 Jun 25. iScience. 2021. PMID: 34142064 Free PMC article. - Standardization of a colorimetric method to quantify growth and metabolic activity of Wolbachia-infected mosquito cells.
Fallon AM, Hellestad VJ. Fallon AM, et al. In Vitro Cell Dev Biol Anim. 2008 Sep-Oct;44(8-9):351-6. doi: 10.1007/s11626-008-9129-6. Epub 2008 Jul 12. In Vitro Cell Dev Biol Anim. 2008. PMID: 18622662 Free PMC article. - SuperPlots: Communicating reproducibility and variability in cell biology.
Lord SJ, Velle KB, Mullins RD, Fritz-Laylin LK. Lord SJ, et al. J Cell Biol. 2020 Jun 1;219(6):e202001064. doi: 10.1083/jcb.202001064. J Cell Biol. 2020. PMID: 32346721 Free PMC article. - Analysis of Statistical Methods Currently used in Toxicology Journals.
Na J, Yang H, Bae S, Lim KM. Na J, et al. Toxicol Res. 2014 Sep;30(3):185-92. doi: 10.5487/TR.2014.30.3.185. Toxicol Res. 2014. PMID: 25343012 Free PMC article.
References
- Belia, S., F. Fidler, J. Williams, and G. Cumming. 2005. Researchers misunderstand confidence intervals and standard error bars. Psychol. Methods. 10:389–396. - PubMed
- Cumming, G., J. Williams, and F. Fidler. 2004. Replication, and researchers' understanding of confidence intervals and standard error bars. Understanding Statistics. 3:299–311.
- Vaux, D.L. 2004. Error message. Nature. 428:799. - PubMed
- Cumming, G., F. Fidler, M. Leonard, P. Kalinowski, A. Christiansen, A. Kleinig, J. Lo, N. McMenamin, and S. Wilson. 2007. Statistical reform in psychology: Is anything changing? Psychol. Sci. In press. - PubMed
- Schenker, N., and J.F. Gentleman. 2001. On judging the significance of differences by examining the overlap between confidence intervals. Am. Stat. 55:182–186.
MeSH terms
LinkOut - more resources
Full Text Sources
Other Literature Sources


