Evidence for a stem cell hierarchy in the adult human breast - PubMed (original) (raw)
Evidence for a stem cell hierarchy in the adult human breast
René Villadsen et al. J Cell Biol. 2007.
Abstract
Cellular pathways that contribute to adult human mammary gland architecture and lineages have not been previously described. In this study, we identify a candidate stem cell niche in ducts and zones containing progenitor cells in lobules. Putative stem cells residing in ducts were essentially quiescent, whereas the progenitor cells in the lobules were more likely to be actively dividing. Cells from ducts and lobules collected under the microscope were functionally characterized by colony formation on tissue culture plastic, mammosphere formation in suspension culture, and morphogenesis in laminin-rich extracellular matrix gels. Staining for the lineage markers keratins K14 and K19 further revealed multipotent cells in the stem cell zone and three lineage-restricted cell types outside this zone. Multiparameter cell sorting and functional characterization with reference to anatomical sites in situ confirmed this pattern. The proposal that the four cell types are indeed constituents of an as of yet undescribed stem cell hierarchy was assessed in long-term cultures in which senescence was bypassed. These findings identify an adult human breast ductal stem cell activity and its earliest descendants.
Figures
Figure 1.
A candidate stem cell zone resides in ducts. Immunoperoxidase staining of ducts (left) and lobules (right) in cryostat sections of the human breast with SSEA-4 (a and b) and keratin K15 (c and d). Staining is strongest in clusters of cells in ducts (brown). Nuclei are counterstained with hematoxylin (blue). Bar, 50 μm.
Figure 2.
A latent or actively dividing proliferative compartment is delineated by laminin-2/4 in lobules. Immunoperoxidase staining of ducts (left) and lobules (right) in cryostat sections of the human breast with Ki-67 (a and b) and laminin-2/4 (c and d). Staining with Ki-67 can approach 50% of the nuclei in lobules as opposed to a mean of 2.8% in ducts. Staining with laminin-2/4 is confined to lobules (brown). Nuclei are counterstained with hematoxylin (blue). Bars, 50 μm.
Figure 3.
Cells with a capacity for clonal growth, self-renewal, and differentiation are derived only from ducts. (A) Duct-derived clonal growth on tissue culture plastic. Phase-contrast micrograph of an uncultured breast organoid released after collagenase digestion. The anatomical composition into ducts and lobules is readily identifiable. (top) Low magnification phase-contrast micrographs of organoids dissected and microcollected into ducts (a) and lobules (b) and plated in separate culture flasks. Structure and morphology are still preserved. (a′ and b′) Low magnification photos of cells in primary culture plated at clonal density and stained with hematoxylin. (a′′ and b′′) Low magnification photos of cells in secondary culture plated at clonal density and stained with hematoxylin. Extended proliferative capacity is seen in cells from ducts. (B) Duct-derived clonal growth and morphogenesis in mammosphere culture and 3D lrECM gels. Phase-contrast micrographs of mammosphere cultures derived from ducts (a) and lobules (b). (a′ and b′) Two morphologies were recorded in each outgrowth from ducts and lobules: large spheres (>70 μm) and small irregular cell clusters (<70 μm). Large spheres are more frequent in duct-derived cultures. (a′′ and b′′) Multicolor imaging of smeared duct- and lobule-derived spheres stained with keratins K19 (red) and K14 (green). Yellow indicates double-stained cells. (a′′′ and b′′′) Morphogenic potential of duct- and lobule-derived spheres upon culture in 3D lrECM. Whereas large, solid spheres had the capacity to develop into budding (TDLU-like) structures, small cell clusters essentially maintained their morphology. Error bars represent SD. Bars: (a, b, a′′′, and b′′′) 100 μm; (a′′ and b′′) 50 μm.
Figure 4.
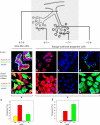
Keratin profiles reveal that K19+/K14+ cells reside in ducts. (top) Drawing illustrating a segment of the breast, including the branching ductal-lobular system, to indicate the approximate location of the cryostat sections. (a–d) Multicolor confocal imaging of cryostat sections of the stained human breast. The sections represent different parts of the ductal-alveolar system as indicated in the drawing. (a′–d′) Cloned primary breast epithelial cells stained for keratin K19 (red), keratin K14 (green), and nuclei (blue). Four epithelial cell types could be identified in the human breast based exclusively on the keratin staining pattern: a, +/+; b, +/−; c, −/−; and d, −/+. Cells double stained for keratins K19 and K14 (+/+) appeared as scattered yellow single cells or small groups of cells in ducts (high magnification inset in a). Yellow pseudocolor represents cells in which the two markers colocalized. These were essentially restricted to duct-derived cultures. Four types of epithelial clones with phenotypes similar to those defined in situ were recorded in cloned primary culture. (e and f) This was substantiated further by quantification of +/+, +/−, and −/+ cells in cultures from microcollected ducts (e) and microcollected lobules (f). Considerable numbers of yellow cells are present in cultures from ducts. Error bars represent SD. Bars, 50 μm.
Figure 5.
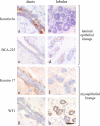
Markers of distinct anatomical locations within the human breast in situ. Immunoperoxidase staining of ducts (left) and lobules (right) in cryostat sections of the human breast with keratin 6a (a and b), BCA-225 (c and d), keratin K17 (e and f), and WT1 (g and h). Each marker exhibits a restricted, albeit for BCA-225 and WT1 somewhat biopsy-dependent, location (brown) in either the luminal or myoepithelial cells of the ducts or lobules, respectively. Nuclei are counterstained with hematoxylin (blue). Bar, 50 μm.
Figure 6.
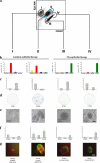
Enrichment of K19+/K14+ cells in a Lin−CD49f+EpCAMhi population of ductal origin. Molecular and functional characterization of subsets of human breast cells. (a) FACS dot plot showing the distribution of Lin− epithelial cells according to their expression of CD49f and EpCAM and the gating strategy used to select four subpopulations (designated I–IV); the Lin−CD49f+EpCAMhi stem cells reside in population II. The blue shading indicates two other gates in which the keratin staining profiles were nearly identical and were, therefore, combined into the larger gate (shown) to maximize cell yield. (b and c) Each population was analyzed in parallel using cell type–specific protein expression analysis. Sorted uncultured cells were allowed to attach directly to glass slides or to a plate in culture to recover from trypsination (for BCA-225) and were then fixed and stained by immunofluorescence (left) to determine the incidence of K14 and K19 expression in the same cell or by immunocytochemistry (right) to determine the proportion of cells within each sorted population that express K6, BCA-225, K17, and WT1. The colors of the bars used in the left bar graph match the pseudocolors assigned to K19 (red) and K14 (green) used throughout this study. Therefore, K19+/K14+ cells are denoted by yellow bars, and −/− cells are denoted by blue bars. Cells were characterized functionally by colony-forming ability on 2D collagen-coated culture dishes (d), clonal density morphogenesis inside 3D lrECM, as expressed in absolute numbers per 10,000 cells seeded (e and f), and bipotency as revealed by staining for K19/K14 (g). This experimental method was repeated on three individually collected reduction mammoplasty specimens. Only cells from population II demonstrated a high incidence of K19+/K14+ (20%) cells. Importantly, this population exhibited substantial colony-forming ability (19/700) and the ability to generate TDLU-like budding structures in 3D lrECM. Error bars represent SD. Bars, 100 μm.
Figure 7.
Immortalization stabilizes the differentiation repertoire in accordance with a breast stem cell hierarchy. (a–d) HPV16 E6/E7 transduced cell lines on tissue culture plastic were stained for keratin K19 (red), keratin K14 (green), and nuclei (blue). Whereas the +/−E6/E7, −/−E6/E7, and −/+E6/E7 cell lines are homogenous with respect to keratin staining, the +/+E6/E7 cell line contains cells representative of each of the other cell lines as well as doubly stained cells (green, blue, red, and yellow). (a′–d′) +/+E6/E7, +/−E6/E7, −/−E6/E7, and −/+E6/E7 cells embedded within 3D lrECM. Whereas TDLU-like structures in cultures from +/+E6/E7 cells were characterized by organoid-like branching morphogenesis, cultures from +/−E6/E7, −/−E6/E7, and −/+E6/E7 cells exclusively formed rounded or irregular cellular clusters. (a′′–d′′) K19 (red) and WT1 (green) expression in structures in 3D lrECM. Bars: (a–d and a′′–d′′) 50 μm; (a′–d′) 100 μm.
Figure 8.
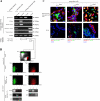
HPV16 E6/E7 transduction reveals that lineage-restricted cells are progenitors. (A) Lineage-restricted cells exhibit a distinct subset of the markers in +/+ cells. RT-PCR of three luminal epithelial-specific markers (EpCAM, estrogen receptor [ER], and keratin K19) and two myoepithelial-specific markers (laminin-α1 and tenascin). All cell lines were further stained for MUC1 and Thy1. Whereas stemlike cells (+/+E6/E7) express low levels of all markers recorded by RT-PCR and no staining for MUC1 and Thy1, lineage-restricted cells exhibit strong expression of the markers for their respective lineages: +/−E6/E7 and −/−E6/E7 are positive for MUC1, and −/+E6/E7cells are positive for Thy1. (B) Robustness of lineages irrespective of retroviral integration site. (before E6/E7, crude) Primary human breast epithelial cells sorted into luminal epithelial MUC1+/Thy1− (red) and myoepithelial MUC1−/Thy1+ (green) fractions and plated in second-passage cultures. (before E6/E7, sorted) Cells from second-passage cultures grown for 14 d and reanalyzed by the same MUC1/Thy1 staining protocol as in the crude panel. There is little or no drifting in the MUC1/Thy1 profiles. (after E6/E7, pooled clones) Cells from flow-sorted second-passage culture reanalyzed by the same MUC1/Thy1 staining protocol as in the before E6/E7 panel but after transduction with HPV16 E6/E7 and selection in the presence of G418 to generate >70 transduced clones per culture. Phenotypic drifting across the lineages was still very limited. (after E6/E7, clonal analysis) RS-PCR of three clones (1–3) of MUC1−/Thy1+ or MUC1+/Thy1− lineage-restricted cells. Different sets of primers were designed based on known genomic RSs (e.g., XmaI). Note the unique RS-PCR profile for each clone (asterisks). (C) Lineage-restricted cells are progenitor cells. Multicolor imaging of cell lines (a–c) and cryostat sections (a′–c′) stained with two luminal epithelial markers of +/−E6/E7 cells, E29 (red) and BCA-225 (green; a and a′); two luminal epithelial markers of −/−E6/E7 cells, CDw75 (red) and keratin K8 (green; b and b′); and two myoepithelial markers of −/+E6/E7 cells, keratin K17 (red) and WT1 (green; c and c′), as well as nuclei (blue). The differentiation program is clearly bimodal, generating both red and green cells. In situ, this bimodality translates into the differentiation of distinct cell types within the luminal epithelial and myoepithelial compartments. Bars, 50 μm.
Similar articles
- In search of a stem cell hierarchy in the human breast and its relevance to breast cancer evolution.
Villadsen R. Villadsen R. APMIS. 2005 Nov-Dec;113(11-12):903-21. doi: 10.1111/j.1600-0463.2005.apm_344.x. APMIS. 2005. PMID: 16480457 Review. - Isolation, immortalization, and characterization of a human breast epithelial cell line with stem cell properties.
Gudjonsson T, Villadsen R, Nielsen HL, Rønnov-Jessen L, Bissell MJ, Petersen OW. Gudjonsson T, et al. Genes Dev. 2002 Mar 15;16(6):693-706. doi: 10.1101/gad.952602. Genes Dev. 2002. PMID: 11914275 Free PMC article. - Tissue-specific designs of stem cell hierarchies.
Visvader JE, Clevers H. Visvader JE, et al. Nat Cell Biol. 2016 Apr;18(4):349-55. doi: 10.1038/ncb3332. Epub 2016 Mar 21. Nat Cell Biol. 2016. PMID: 26999737 - Anatomical localization of progenitor cells in human breast tissue reveals enrichment of uncommitted cells within immature lobules.
Arendt LM, Keller PJ, Skibinski A, Goncalves K, Naber SP, Buchsbaum RJ, Gilmore H, Come SE, Kuperwasser C. Arendt LM, et al. Breast Cancer Res. 2014 Oct 15;16(5):453. doi: 10.1186/s13058-014-0453-3. Breast Cancer Res. 2014. PMID: 25315014 Free PMC article. - The mammary stem cell hierarchy.
Fu N, Lindeman GJ, Visvader JE. Fu N, et al. Curr Top Dev Biol. 2014;107:133-60. doi: 10.1016/B978-0-12-416022-4.00005-6. Curr Top Dev Biol. 2014. PMID: 24439805 Review.
Cited by
- Mechanisms that clear mutations drive field cancerization in mammary tissue.
Ciwinska M, Messal HA, Hristova HR, Lutz C, Bornes L, Chalkiadakis T, Harkes R, Langedijk NSM, Hutten SJ, Menezes RX, Jonkers J, Prekovic S; Grand Challenge PRECISION consortium; Simons BD, Scheele CLGJ, van Rheenen J. Ciwinska M, et al. Nature. 2024 Sep;633(8028):198-206. doi: 10.1038/s41586-024-07882-3. Epub 2024 Sep 4. Nature. 2024. PMID: 39232148 Free PMC article. - Development of a screen to identify selective small molecules active against patient-derived metastatic and chemoresistant breast cancer cells.
Gligorich KM, Vaden RM, Shelton DN, Wang G, Matsen CB, Looper RE, Sigman MS, Welm BE. Gligorich KM, et al. Breast Cancer Res. 2013;15(4):R58. doi: 10.1186/bcr3452. Breast Cancer Res. 2013. PMID: 23879992 Free PMC article. - Expression and functional role of sprouty-2 in breast morphogenesis.
Sigurdsson V, Ingthorsson S, Hilmarsdottir B, Gustafsdottir SM, Franzdottir SR, Arason AJ, Steingrimsson E, Magnusson MK, Gudjonsson T. Sigurdsson V, et al. PLoS One. 2013;8(4):e60798. doi: 10.1371/journal.pone.0060798. Epub 2013 Apr 3. PLoS One. 2013. PMID: 23573284 Free PMC article. - Mechanisms of the epithelial-mesenchymal transition by TGF-beta.
Wendt MK, Allington TM, Schiemann WP. Wendt MK, et al. Future Oncol. 2009 Oct;5(8):1145-68. doi: 10.2217/fon.09.90. Future Oncol. 2009. PMID: 19852727 Free PMC article. Review. - The pathophysiology of epithelial-mesenchymal transition induced by transforming growth factor-beta in normal and malignant mammary epithelial cells.
Taylor MA, Parvani JG, Schiemann WP. Taylor MA, et al. J Mammary Gland Biol Neoplasia. 2010 Jun;15(2):169-90. doi: 10.1007/s10911-010-9181-1. Epub 2010 May 15. J Mammary Gland Biol Neoplasia. 2010. PMID: 20467795 Free PMC article. Review.
References
- Behbod, F., and J.M. Rosen. 2005. Will cancer stem cells provide new therapeutic targets? Carcinogenesis. 26:703–711. - PubMed
Publication types
MeSH terms
Substances
LinkOut - more resources
Full Text Sources
Other Literature Sources
Medical
Research Materials


