Phospholipase C-gamma1 is required for the activation of store-operated Ca2+ channels in liver cells - PubMed (original) (raw)
Phospholipase C-gamma1 is required for the activation of store-operated Ca2+ channels in liver cells
Tom Litjens et al. Biochem J. 2007.
Abstract
Repetitive hormone-induced changes in concentration of free cytoplasmic Ca2+ in hepatocytes require Ca2+ entry through receptor-activated Ca2+ channels and SOCs (store-operated Ca2+ channels). SOCs are activated by a decrease in Ca2+ concentration in the intracellular Ca2+ stores, but the molecular components and mechanisms are not well understood. Some studies with other cell types suggest that PLC-gamma (phospholipase C-gamma) is involved in the activation of receptor-activated Ca2+ channels and/or SOCs, independently of PLC-gamma-mediated generation of IP3 (inositol 1,4,5-trisphosphate). The nature of the Ca2+ channels regulated by PLC-gamma has not been defined clearly. The aim of the present study was to determine if PLC-gamma is required for the activation of SOCs in liver cells. Transfection of H4IIE cells derived from rat hepatocytes with siRNA (short interfering RNA) targeted to PLC-gamma1 caused a reduction (by approx. 70%) in the PLC-gamma1 protein expression, with maximal effect at 72-96 h. This was associated with a decrease (by approx. 60%) in the amplitude of the I(SOC) (store-operated Ca2+ current) developed in response to intracellular perfusion with either IP(3) or thapsigargin. Knockdown of STIM1 (stromal interaction molecule type 1) by siRNA also resulted in a significant reduction (approx. 80% at 72 h post-transfection) of the I(SOC) amplitude. Immunoprecipitation of PLC-gamma1 and STIM1, however, suggested that under the experimental conditions these proteins do not interact with each other. It is concluded that the PLC-gamma1 protein, independently of IP3 generation and STIM1, is required to couple endoplasmic reticulum Ca2+ release to the activation of SOCs in the plasma membrane of H4IIE liver cells.
Figures
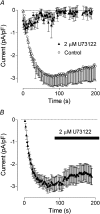
Figure 1. Effect of the PLC inhibitor U73122 on the ISOC in H4IIE cells
(A) Pre-incubation of H4IIE cells with 2 μM of U73122 for 2–5 min inhibited activation of ISOC by intracellular perfusion with 20 μM IP3 (closed symbols, _n_=6). For comparison, activation of ISOC by IP3 is shown in untreated cells (open symbols, _n_=4).(B) Application of U73122 to the bath after the ISOC had fully developed had no effect on its amplitude. Each point represents the amplitude of ISOC at −118 mV taken from voltage ramps from −138 to 102 mV, applied every 2 s.
Figure 2. Knockdown of PLC-γ1 in H4IIE cells by a specific siRNA
(A) Immunofluorescence microscopy of PLC-γ1 (green) in cells transfected for 96 h with negative control siRNA (first row) and PLC-γ1-01 siRNA (second row). Second column shows staining of the cells nuclei with DAPI (blue), and third column shows merged images. Results are representative of four individual experiments. Bar=20 μm. (B) Reduction of the PLC-γ1 protein as determined by Western blotting. Expression of GAPDH served as a loading control. Molecular mass markers are indicated on the left-hand side of the Figure. Results are representative of four individual experiments.
Figure 3. Immunofluorescence microscopy analysis of siRNA transfection efficiency
H4IIE cells were co-transfected with 38 nM unlabelled PLC-γ1-01 siRNA and 38 nM AlexaFluor-546-labelled negative control siRNA. At 96 h after transfection the cells were fixed, immunostained with anti-PLC-γ1 antibody, followed by incubation with FITC-conjugated secondary antibody and then the nuclei were counterstained with DAPI (blue). H4IIE cells co-transfected with PLC-γ1-01 siRNA (unlabelled) and AlexaFluor-546-labelled negative control siRNA (red) show reduced PLC-γ1 expression (green) compared with neighbouring non-transfected cells. Bar=20 μm.
Figure 4. Effect of PLC-γ1 knockdown on ISOC in H4IIE cells
(A) Development of ISOC in response to intracellular IP3 in H4IIE cells treated with either control siRNA or PLC-γ1-01 siRNA for 72 and 96 h. (B) Scatter plot of the data presented in panel (A) and the data obtained on non-transfected cells and cells treated with transfection reagent only at 90 s after establishing whole cell. The P values are relative to the Control (cells transfected with control siRNA). (C) Activation of ISOC by intracellular application of thapsigargin in H4IIE cells treated with either control siRNA or PLC-γ1-01 siRNA for 96 h.
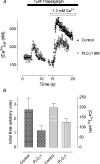
Figure 5. Effect of PLC-γ1 knockdown on thapsigargin-induced Ca2+ entry in H4IIE cells
(A) Reduction of thapsigargin-induced Ca2+ entry in H4IIE cells treated with PLC-γ1-01 siRNA (open symbols) compared with cells treated with control siRNA (closed symbols), at 96 h post-transfection. The results are shown as means±S.E.M. for 15–20 cells; _n_=4. (B) Reduction of the initial rate and the peak concentration of thapsigargin-induced Ca2+ entry by PLC-γ1 knockdown in four separate experiments (96 h post-transfection). The results are shown as means±S.E.M. for four independent experiments.
Figure 6. Dependence of the ISOC in H4IIE cells on PIP2
Development of the ISOC in H4IIE cells transfected with control siRNA for 72–96 h and treated with 10 μM PIP2 for either 20 min or overnight. Each point represents the amplitude of ISOC at −118 mV taken from voltage ramps from −138 to 102 mV, applied every 2 s.
Figure 7. Knockdown of STIM1 in H4IIE cells by specific siRNA
Immunofluorescence microscopy of STIM1 (green) in cells transfected for 96 h with negative control siRNA (first row) and STIM1-01 siRNA (second row). Second column shows staining of the cells nuclei with DAPI (blue) and the third column shows the merged images. Results are representative of three individual experiments. Bar=20 μm.
Figure 8. Effect of STIM1 knockdown on ISOC in H4IIE cells
Development of ISOC in response to intracellular IP3 in H4IIE cells treated with either control siRNA or STIM1-01 siRNA for 48 and 72 h. Each point represents the amplitude of ISOC at −118 mV taken from voltage ramps from −138 to 102 mV, applied every 2 s.
Figure 9. Immunoprecipitation of STIM1 and PLC-γ1
(A) Cell lysates (100 μg) or lysis buffer only (LB) were immunoprecipitated (IP) with anti-STIM1 antibody (+) [or PBS as a negative control (−)] and the immunoprecipitates were analysed by immunoblotting (IB) with anti-PLCγ1 antibody. H4IIE cells were either untreated (−TG) or treated (+TG) with 1 μM thapsigargin and cell lysates were prepared using Ca2+-supplemented (5 mM free Ca2+) lysis buffer. Positive controls included non-immunoprecipitated lysates (10 μg) from cells untreated (C1) or treated (C2) with 1 μM thapsigargin. No STIM1-immunoprecipitated 150 kDa PLC-γ1 band was observed in either the untreated or thapsigargin treated cell lysates. Molecular mass markers (M) are indicated to the right-hand side of the Figure. The results are representative of two independent experiments. (B) Cell lysates (100 μg) or lysis buffer only (LB) were immunoprecipitated (IP) with anti-PLC-γ1 antibody (+) [or PBS (−)] and the immunoprecipitates were analysed by immunoblotting (IB) with anti-STIM1 antibody. No PLCγ1-immunoprecipitated 85 kDa STIM1 band was observed in either the untreated or thapsigargin-treated cell lysates. The results are representative of two independent experiments. The band at approx. 75 kDa present in the IP(+) samples, including the lysis buffer only sample, is most probably non-denatured anti-PLCγ1 immunoprecipitating antibody. The faint band at approx. 95 kDa present in both IP(−) and IP(+) samples, including the lysis buffer only samples, is most probably an artefact due to the Protein A/G Plus agarose beads.
Similar articles
- Depressing time: Waiting, melancholia, and the psychoanalytic practice of care.
Salisbury L, Baraitser L. Salisbury L, et al. In: Kirtsoglou E, Simpson B, editors. The Time of Anthropology: Studies of Contemporary Chronopolitics. Abingdon: Routledge; 2020. Chapter 5. In: Kirtsoglou E, Simpson B, editors. The Time of Anthropology: Studies of Contemporary Chronopolitics. Abingdon: Routledge; 2020. Chapter 5. PMID: 36137063 Free Books & Documents. Review. - Comparison of Two Modern Survival Prediction Tools, SORG-MLA and METSSS, in Patients With Symptomatic Long-bone Metastases Who Underwent Local Treatment With Surgery Followed by Radiotherapy and With Radiotherapy Alone.
Lee CC, Chen CW, Yen HK, Lin YP, Lai CY, Wang JL, Groot OQ, Janssen SJ, Schwab JH, Hsu FM, Lin WH. Lee CC, et al. Clin Orthop Relat Res. 2024 Dec 1;482(12):2193-2208. doi: 10.1097/CORR.0000000000003185. Epub 2024 Jul 23. Clin Orthop Relat Res. 2024. PMID: 39051924 - A Blog-Based Study of Autistic Adults' Experiences of Aloneness and Connection and the Interplay with Well-Being: Corpus-Based and Thematic Analyses.
Petty S, Allen S, Pickup H, Woodier B. Petty S, et al. Autism Adulthood. 2023 Dec 1;5(4):437-449. doi: 10.1089/aut.2022.0073. Epub 2023 Dec 12. Autism Adulthood. 2023. PMID: 38116056 Free PMC article. - Antioxidants for female subfertility.
Showell MG, Mackenzie-Proctor R, Jordan V, Hart RJ. Showell MG, et al. Cochrane Database Syst Rev. 2020 Aug 27;8(8):CD007807. doi: 10.1002/14651858.CD007807.pub4. Cochrane Database Syst Rev. 2020. PMID: 32851663 Free PMC article. - Pharmacological treatments in panic disorder in adults: a network meta-analysis.
Guaiana G, Meader N, Barbui C, Davies SJ, Furukawa TA, Imai H, Dias S, Caldwell DM, Koesters M, Tajika A, Bighelli I, Pompoli A, Cipriani A, Dawson S, Robertson L. Guaiana G, et al. Cochrane Database Syst Rev. 2023 Nov 28;11(11):CD012729. doi: 10.1002/14651858.CD012729.pub3. Cochrane Database Syst Rev. 2023. PMID: 38014714 Free PMC article. Review.
Cited by
- Phosphatidylinositol-4-phosphate 5-kinase 1alpha mediates extracellular calcium-induced keratinocyte differentiation.
Xie Z, Chang SM, Pennypacker SD, Liao EY, Bikle DD. Xie Z, et al. Mol Biol Cell. 2009 Mar;20(6):1695-704. doi: 10.1091/mbc.e08-07-0756. Epub 2009 Jan 21. Mol Biol Cell. 2009. PMID: 19158393 Free PMC article. - Store depletion induces Gαq-mediated PLCβ1 activity to stimulate TRPC1 channels in vascular smooth muscle cells.
Shi J, Miralles F, Birnbaumer L, Large WA, Albert AP. Shi J, et al. FASEB J. 2016 Feb;30(2):702-15. doi: 10.1096/fj.15-280271. Epub 2015 Oct 14. FASEB J. 2016. PMID: 26467792 Free PMC article. - Properties of Orai1 mediated store-operated current depend on the expression levels of STIM1 and Orai1 proteins.
Scrimgeour N, Litjens T, Ma L, Barritt GJ, Rychkov GY. Scrimgeour N, et al. J Physiol. 2009 Jun 15;587(Pt 12):2903-18. doi: 10.1113/jphysiol.2009.170662. Epub 2009 Apr 29. J Physiol. 2009. PMID: 19403622 Free PMC article. - Phosphorylation of Nephrin Triggers Ca2+ Signaling by Recruitment and Activation of Phospholipase C-{gamma}1.
Harita Y, Kurihara H, Kosako H, Tezuka T, Sekine T, Igarashi T, Ohsawa I, Ohta S, Hattori S. Harita Y, et al. J Biol Chem. 2009 Mar 27;284(13):8951-62. doi: 10.1074/jbc.M806851200. Epub 2009 Jan 29. J Biol Chem. 2009. PMID: 19179337 Free PMC article. - Transmembrane adaptor protein PAG/CBP is involved in both positive and negative regulation of mast cell signaling.
Draberova L, Bugajev V, Potuckova L, Halova I, Bambouskova M, Polakovicova I, Xavier RJ, Seed B, Draber P. Draberova L, et al. Mol Cell Biol. 2014 Dec 1;34(23):4285-300. doi: 10.1128/MCB.00983-14. Epub 2014 Sep 22. Mol Cell Biol. 2014. PMID: 25246632 Free PMC article.
References
- Bird G. S., Aziz O., Lievremont J. P., Wedel B. J., Trebak M., Vazquez G., Putney J. W., Jr Mechanisms of phospholipase C-regulated calcium entry. Curr. Mol. Med. 2004;4:291–301. - PubMed
- Prakriya M., Feske S., Gwack Y., Srikanth S., Rao A., Hogan P. G. Orai1 is an essential pore subunit of the CRAC channel. Nature. 2006;443:230–233. - PubMed
- Patterson R. L., van Rossum D. B., Ford D. L., Hurt K. J., Bae S. S., Suh P. G., Kurosaki T., Snyder S. H., Gill D. L. Phospholipase C-γ is required for agonist-induced Ca2+ entry. Cell. 2002;111:529–541. - PubMed
Publication types
MeSH terms
Substances
LinkOut - more resources
Full Text Sources
Molecular Biology Databases
Miscellaneous


