Hubs in biological interaction networks exhibit low changes in expression in experimental asthma - PubMed (original) (raw)
Hubs in biological interaction networks exhibit low changes in expression in experimental asthma
Xin Lu et al. Mol Syst Biol. 2007.
Abstract
Asthma is a complex polygenic disease involving the interaction of many genes. In this study, we investigated the allergic response in experimental asthma. First, we constructed a biological interaction network using the BOND (Biomolecular Object Network Databank) database of literature curated molecular interactions. Second, we mapped differentially expressed genes from microarray data onto the network. Third, we analyzed the topological characteristics of the modulated genes. Fourth, we analyzed the correlation between the topology and biological function using the Gene Ontology classifications. Our results demonstrate that nodes with high connectivity (hubs and superhubs) tend to have low levels of change in gene expression. The significance of our observations was confirmed by permutation testing. Furthermore, our analysis indicates that hubs and superhubs have significantly different biological functions compared with peripheral nodes based on Gene Ontology classification. Our observations have important ramifications for interpreting gene expression data and understanding biological responses. Thus, our analysis suggests that a combination of differential gene expression plus topological characteristics of the interaction network provides enhanced understanding of the biology in our model of experimental asthma.
Figures
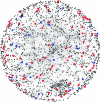
Figure 1
Mouse gene network from BIND. Red and blue spots represent genes that were significantly up- or downregulated.
Figure 2
Scatter plot of _t_-statistics versus connectivity for genes modulated in OVA-specific allergic immune response. (A) Wild-type mice. (B) RAG KO mice. _X_-axis is the log 2 of connectivity (no. of genes directly connected) and _Y_-axis is the absolute of _t_-statistics. Red and blue spots represent genes upregulated or downregulated, respectively, in response to OVA sensitization and challenge with individual _P_-values below 0.05. Empty circles correspond to non-differentially expressed genes.
Similar articles
- Screening of differentially expressed genes and small molecule drugs of pediatric allergic asthma with DNA microarray.
Wang XQ, Wang XM, Zhou TF, Dong LQ. Wang XQ, et al. Eur Rev Med Pharmacol Sci. 2012 Dec;16(14):1961-6. Eur Rev Med Pharmacol Sci. 2012. PMID: 23242723 - Protein-protein interaction network analysis of children atopic asthma.
Liu Y, Liu S. Liu Y, et al. Eur Rev Med Pharmacol Sci. 2012 Jul;16(7):867-72. Eur Rev Med Pharmacol Sci. 2012. PMID: 22953633 - Discovery of core biotic stress responsive genes in Arabidopsis by weighted gene co-expression network analysis.
Amrine KC, Blanco-Ulate B, Cantu D. Amrine KC, et al. PLoS One. 2015 Mar 2;10(3):e0118731. doi: 10.1371/journal.pone.0118731. eCollection 2015. PLoS One. 2015. PMID: 25730421 Free PMC article. - Gene expression profiling in allergy and asthma.
Schmidt-Weber CB. Schmidt-Weber CB. Chem Immunol Allergy. 2006;91:188-94. doi: 10.1159/000090281. Chem Immunol Allergy. 2006. PMID: 16354959 Review. - MicroRNA regulation of allergic inflammation and asthma.
Pua HH, Ansel KM. Pua HH, et al. Curr Opin Immunol. 2015 Oct;36:101-8. doi: 10.1016/j.coi.2015.07.006. Epub 2015 Aug 5. Curr Opin Immunol. 2015. PMID: 26253882 Free PMC article. Review.
Cited by
- Application of bi-clustering of gene expression data and gene set enrichment analysis methods to identify potentially disease causing nanomaterials.
Williams A, Halappanavar S. Williams A, et al. Data Brief. 2017 Oct 26;15:933-940. doi: 10.1016/j.dib.2017.10.060. eCollection 2017 Dec. Data Brief. 2017. PMID: 29159232 Free PMC article. - Identification of shared biological features in four different lung cell lines infected with SARS-CoV-2 virus through RNA-seq analysis.
Zhang X, Ahn S, Qiu P, Datta S. Zhang X, et al. Front Genet. 2023 Aug 16;14:1235927. doi: 10.3389/fgene.2023.1235927. eCollection 2023. Front Genet. 2023. PMID: 37662846 Free PMC article. - Persistent activation of interlinked type 2 airway epithelial gene networks in sputum-derived cells from aeroallergen-sensitized symptomatic asthmatics.
Jones AC, Troy NM, White E, Hollams EM, Gout AM, Ling KM, Kicic A, Stick SM, Sly PD, Holt PG, Hall GL, Bosco A. Jones AC, et al. Sci Rep. 2018 Jan 24;8(1):1511. doi: 10.1038/s41598-018-19837-6. Sci Rep. 2018. PMID: 29367592 Free PMC article. - Identification of miRNA-Mediated Subpathways as Prostate Cancer Biomarkers Based on Topological Inference in a Machine Learning Process Using Integrated Gene and miRNA Expression Data.
Ning Z, Yu S, Zhao Y, Sun X, Wu H, Yu X. Ning Z, et al. Front Genet. 2021 Mar 24;12:656526. doi: 10.3389/fgene.2021.656526. eCollection 2021. Front Genet. 2021. PMID: 33841512 Free PMC article. - Pooled genome-wide analysis to identify novel risk loci for pediatric allergic asthma.
Ricci G, Astolfi A, Remondini D, Cipriani F, Formica S, Dondi A, Pession A. Ricci G, et al. PLoS One. 2011 Feb 16;6(2):e16912. doi: 10.1371/journal.pone.0016912. PLoS One. 2011. PMID: 21359210 Free PMC article.
References
- Barabasi AL, Oltvai ZN (2004) Network biology: understanding the cell's functional organization. Nat Rev Genet 5: 101–113 - PubMed
- Benjamini Y, Hochberg Y (1995) Controlling the false discovery rate: a practical and powerful approach to multiple testing. J R Statist Soc B 57: 289–300
- Braman SS (2006) The global burden of asthma. Chest 130: 4S–12S - PubMed
- Han JJD, Bertin N, Hao T, Goldberg DS, Berriz GF, Zhang LV, Dupuy D, Walhout AJM, Cusick ME, Roth FP, Vidal M. (2004) Evidence for dynamically organized modularity in the yeast protein–protein interaction network. Nature 430: 88–93 - PubMed
Publication types
MeSH terms
Grants and funding
- R01 AI053878/AI/NIAID NIH HHS/United States
- R01 HL081663/HL/NHLBI NIH HHS/United States
- R01AI053878/AI/NIAID NIH HHS/United States
- R01HL081663/HL/NHLBI NIH HHS/United States
LinkOut - more resources
Full Text Sources
Medical
Molecular Biology Databases

