Entrainment to feeding but not to light: circadian phenotype of VPAC2 receptor-null mice - PubMed (original) (raw)
Entrainment to feeding but not to light: circadian phenotype of VPAC2 receptor-null mice
W John Sheward et al. J Neurosci. 2007.
Abstract
The master clock driving mammalian circadian rhythms is located in the suprachiasmatic nuclei (SCN) of the hypothalamus and entrained by daily light/dark cycles. SCN lesions abolish circadian rhythms of behavior and result in a loss of synchronized circadian rhythms of clock gene expression in peripheral organs (e.g., the liver) and of hormone secretion (e.g., corticosterone). We examined rhythms of behavior, hepatic clock gene expression, and corticosterone secretion in VPAC2 receptor-null (Vipr2-/-) mice, which lack a functional SCN clock. Unexpectedly, although Vipr2-/- mice lacked robust circadian rhythms of wheel-running activity and corticosterone secretion, hepatic clock gene expression was strongly rhythmic, but advanced in phase compared with that in wild-type mice. The timing of food availability is thought to be an important entrainment signal for circadian clocks outside the SCN. Vipr2-/- mice consumed food significantly earlier in the 24 h cycle than wild-type mice, consistent with the observed timing of peripheral rhythms of circadian gene expression. When restricted to feeding only during the daytime (RF), mice develop rhythms of activity and of corticosterone secretion in anticipation of feeding time, thought to be driven by a food-entrainable circadian oscillator, located outside the SCN. Under RF, mice of both genotypes developed food-anticipatory rhythms of activity and corticosterone secretion, and hepatic gene expression rhythms also became synchronized to the RF stimulus. Thus, food intake is an effective zeitgeber capable of coordinating circadian rhythms of behavior, peripheral clock gene expression, and hormone secretion, even in the absence of a functional SCN clock.
Figures
Figure 1.
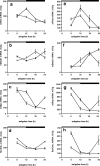
Rhythms of food intake and wheel running in wild-type and _Vipr2_−/− mice fed ad libitum. A, B, Representative profiles of locomotor activity in wild-type (A) and _Vipr2_−/− (B) mice are presented in double-plotted format. Periods of darkness are shaded. For the first 16 d, animals were exposed to a 12 h LD cycle (darkness from 7:00 P.M. to 7:00 A.M.). From day 17, animals were maintained in constant darkness. C–F, Cumulative wheel running counts (C, D) and food intake (E, F) were monitored in wild-type (black bars) and _Vipr2_−/− (gray bars) mice over 4 h periods for 48 h in LD (C, E) or 2 d after transfer into DD (D, F). Values represent mean ± SEM; n = 8. The bars at the top indicate the dark period in black and the light period in white (C, E) or subjective night in black and subjective day in gray (D, F). *p < 0.05; **p < 0.01; ***p < 0.001 compared with _Vipr2_−/−.
Figure 2.
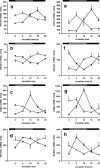
Rhythms of clock gene expression in the liver of wild-type and _Vipr2_−/− mice. Values represent mean ± SEM; n = 5–8. A–D, Rhythms of Per1 (A, B) and Per2 (C, D) gene expression in the liver of wild-type (filled squares) and _Vipr2_−/− (open squares) mice in LD (A, C) or 2 d after transfer into DD (B, D) under conditions of ad libitum feeding are shown. Data were obtained by TaqMan RT-PCR. In each panel, one 24 h set of data has been plotted twice to better show the pattern of variation with time. The bars at the top indicate the dark period in black and the light period in white (A, C) or subjective night in black and subjective day in gray (B, D). *p < 0.05; **p < 0.01; ***p < 0.001 compared with _Vipr2_−/−.
Figure 3.
a–h, Rhythms of clock gene expression in the heart (a–d) and liver (e–h) of wild-type and _Vipr2_−/− mice in LD. Rhythms of Per2 (a, e), Bmal1 (b, f), Dbp (c, g), and _RevErb_α (d, h) gene expression in wild-type (filled squares) and _Vipr2_−/− (open squares) mice are shown. Data were obtained by in situ hybridization. The bars at the top indicate the dark period in black and the light period in white. Values represent mean ± SEM.
Figure 4.
a–h, Rhythms of clock gene expression in the heart (a–d) and liver (e–h) of wild-type and _Vipr2_−/− mice 2 d after transfer into DD. Rhythms of Per2 (a, e), Bmal1 (b, f), Dbp (c, g), and _RevErb_α (d, h) gene expression in wild-type (filled squares) and _Vipr2_−/− (open squares) mice are shown. Data were obtained by in situ hybridization. The bars at the top indicate subjective night in black and subjective day in gray. Values represent mean ± SEM.
Figure 5.
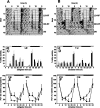
Entrainment of behavior and clock gene expression to an RF schedule in _Vipr2_−/− mice. A, B, Representative profiles of locomotor activity in wild-type (A) and _Vipr2_−/− (B) mice are presented in double-plotted format. After an initial period of entrainment to an LD cycle with ad libitum access to food (LD; days 1–4), food availability was reduced to 4 h/d (A, B, boxed regions; from 11:00 A.M. to 3:00 P.M.), initially in an LD cycle (LD-RF; days 5–21) and subsequently in DD (DD-RF; days 22–34). Ad libitum access to food was then restored (DD; days 35–43). C, D, Cumulative wheel running counts were monitored under an RF schedule in wild-type (black bars) and _Vipr2_−/− (gray bars) mice over 4 h periods for 48 h in LD (C) or 2 d after transfer into DD (D). E, F, Rhythms of Per1 gene expression in the liver of wild-type (filled squares) and _Vipr2_−/− (open squares) mice under an RF schedule were measured by TaqMan RT-PCR in LD (E) or 2 d after transfer into DD (F). One 24 h set of data has been plotted twice to better show the pattern of variation with time. C–F, The bars at the top indicate the dark period in black and the light period in white (C, E) or subjective night in black and subjective day in gray (D, F). The period of food availability in C–F is indicated by a striped bar. Values represent mean ± SEM.
Figure 6.
Rhythms of corticosterone secretion in wild-type and _Vipr2_−/− mice. Values represent mean ± SEM; n = 5–8. A–D, Peripheral blood was sampled at 4 h intervals from wild-type (filled squares) and _Vipr2_−/− (open squares) mice housed in a 12/12 h LD cycle (A, C) or 2 d after transfer into constant darkness (B, D) under conditions of ad libitum feeding (A, B) or with RF (C, D). In each panel, one 24 h set of data has been plotted twice to better show the pattern of variation with time. The bars at the top indicate the dark period in black and the light period in white (A, C) or subjective night in black and subjective day in gray (B, D). C, D, The period of food availability is indicated by a striped bar. *p < 0.05; **p < 0.01; ***p < 0.001 compared with _Vipr2_−/−.
Similar articles
- Altered rhythm of adrenal clock genes, StAR and serum corticosterone in VIP receptor 2-deficient mice.
Fahrenkrug J, Georg B, Hannibal J, Jørgensen HL. Fahrenkrug J, et al. J Mol Neurosci. 2012 Nov;48(3):584-96. doi: 10.1007/s12031-012-9804-7. Epub 2012 May 24. J Mol Neurosci. 2012. PMID: 22622901 - Phase shifts in circadian peripheral clocks caused by exercise are dependent on the feeding schedule in PER2::LUC mice.
Sasaki H, Hattori Y, Ikeda Y, Kamagata M, Iwami S, Yasuda S, Shibata S. Sasaki H, et al. Chronobiol Int. 2016;33(7):849-62. doi: 10.3109/07420528.2016.1171775. Epub 2016 Apr 28. Chronobiol Int. 2016. PMID: 27123825 - Daily restricted feeding resets the circadian clock in the suprachiasmatic nucleus of CS mice.
Abe H, Honma S, Honma K. Abe H, et al. Am J Physiol Regul Integr Comp Physiol. 2007 Jan;292(1):R607-15. doi: 10.1152/ajpregu.00331.2006. Epub 2006 Sep 21. Am J Physiol Regul Integr Comp Physiol. 2007. PMID: 16990494 - An essential role for peptidergic signalling in the control of circadian rhythms in the suprachiasmatic nuclei.
Harmar AJ. Harmar AJ. J Neuroendocrinol. 2003 Apr;15(4):335-8. doi: 10.1046/j.1365-2826.2003.01005.x. J Neuroendocrinol. 2003. PMID: 12622830 Review. - Neurobiology of food anticipatory circadian rhythms.
Mistlberger RE. Mistlberger RE. Physiol Behav. 2011 Sep 26;104(4):535-45. doi: 10.1016/j.physbeh.2011.04.015. Epub 2011 Apr 20. Physiol Behav. 2011. PMID: 21527266 Review.
Cited by
- Does Circadian Disruption Play a Role in the Metabolic-Hormonal Link to Delayed Lactogenesis II?
Fu M, Zhang L, Ahmed A, Plaut K, Haas DM, Szucs K, Casey TM. Fu M, et al. Front Nutr. 2015 Feb 23;2:4. doi: 10.3389/fnut.2015.00004. eCollection 2015. Front Nutr. 2015. PMID: 25988133 Free PMC article. Review. - Circadian control of mouse heart rate and blood pressure by the suprachiasmatic nuclei: behavioral effects are more significant than direct outputs.
Sheward WJ, Naylor E, Knowles-Barley S, Armstrong JD, Brooker GA, Seckl JR, Turek FW, Holmes MC, Zee PC, Harmar AJ. Sheward WJ, et al. PLoS One. 2010 Mar 22;5(3):e9783. doi: 10.1371/journal.pone.0009783. PLoS One. 2010. PMID: 20339544 Free PMC article. - PACAP and VIP Neuropeptides' and Receptors' Effects on Appetite, Satiety and Metabolism.
Vu JP, Luong L, Sanford D, Oh S, Kuc A, Pisegna R, Lewis M, Pisegna JR, Germano PM. Vu JP, et al. Biology (Basel). 2023 Jul 17;12(7):1013. doi: 10.3390/biology12071013. Biology (Basel). 2023. PMID: 37508442 Free PMC article. Review. - Light phase testing of social behaviors: not a problem.
Yang M, Weber MD, Crawley JN. Yang M, et al. Front Neurosci. 2008 Dec 15;2(2):186-91. doi: 10.3389/neuro.01.029.2008. eCollection 2008 Dec. Front Neurosci. 2008. PMID: 19225591 Free PMC article. - Natural food intake patterns have little synchronizing effect on peripheral circadian clocks.
Xie X, Kukino A, Calcagno HE, Berman AM, Garner JP, Butler MP. Xie X, et al. BMC Biol. 2020 Nov 6;18(1):160. doi: 10.1186/s12915-020-00872-7. BMC Biol. 2020. PMID: 33158435 Free PMC article.
References
- Abe K, Kroning J, Greer MA, Critchlow V. Effects of destruction of the suprachiasmatic nuclei on the circadian rhythms in plasma corticosterone, body temperature, feeding and plasma thyrotropin. Neuroendocrinology. 1979;29:119–131. - PubMed
- Akhtar RA, Reddy AB, Maywood ES, Clayton JD, King VM, Smith AG, Gant TW, Hastings MH, Kyriacou CP. Circadian cycling of the mouse liver transcriptome, as revealed by cDNA microarray, is driven by the suprachiasmatic nucleus. Curr Biol. 2002;12:540–550. - PubMed
- Balsalobre A, Damiola F, Schibler U. A serum shock induces circadian gene expression in mammalian tissue culture cells. Cell. 1998;93:929–937. - PubMed
Publication types
MeSH terms
Substances
LinkOut - more resources
Full Text Sources
Molecular Biology Databases


