Proteomic screen defines the Polo-box domain interactome and identifies Rock2 as a Plk1 substrate - PubMed (original) (raw)
Proteomic screen defines the Polo-box domain interactome and identifies Rock2 as a Plk1 substrate
Drew M Lowery et al. EMBO J. 2007.
Abstract
Polo-like kinase-1 (Plk1) phosphorylates a number of mitotic substrates, but the diversity of Plk1-dependent processes suggests the existence of additional targets. Plk1 contains a specialized phosphoserine-threonine binding domain, the Polo-box domain (PBD), postulated to target the kinase to its substrates. Using the specialized PBD of Plk1 as an affinity capture agent, we performed a screen to define the mitotic Plk1-PBD interactome by mass spectrometry. We identified 622 proteins that showed phosphorylation-dependent mitosis-specific interactions, including proteins involved in well-established Plk1-regulated processes, and in processes not previously linked to Plk1 such as translational control, RNA processing, and vesicle transport. Many proteins identified in our screen play important roles in cytokinesis, where, in mammalian cells, the detailed mechanistic role of Plk1 remains poorly defined. We go on to characterize the mitosis-specific interaction of the Plk1-PBD with the cytokinesis effector kinase Rho-associated coiled-coil domain-containing protein kinase 2 (Rock2), demonstrate that Rock2 is a Plk1 substrate, and show that Rock2 colocalizes with Plk1 during cytokinesis. Finally, we show that Plk1 and RhoA function together to maximally enhance Rock2 kinase activity in vitro and within cells, and implicate Plk1 as a central regulator of multiple pathways that synergistically converge to regulate actomyosin ring contraction during cleavage furrow ingression.
Figures
Figure 1
The PBD of Plk1 preferentially binds ligands in mitosis. (A) Domain structure of Plk1. Residues His-538 and Lys-540 are required for phosphopeptide binding by the PBD. (B) Experimental strategy for identifying cell-cycle-dependent PBD ligands. (C) Purity and equivalence of recombinant wild-type (WT) and mutant (MUT) PBDs used for interaction screening. Samples were analyzed by SDS–PAGE and stained with Coomassie blue. (D) U2OS cells were synchronized at the G1/S transition by a double thymidine block or in M-phase by nocodazole treatment, and DNA content analyzed by flow cytometry. (E) WT and MUT PBD were used to pull down interaction partners from double thymidine blocked or the nocodazole-arrested U2OS cell lysates. Bound proteins were separated by SDS–PAGE and visualized by SYPRO Ruby staining. Lines on the right of gel indicate where gel was cut before subsequent mass spectrometry analysis with each labeled section correlated with Supplementary Table S1.
Figure 2
Mitotic proteins bind to the PBD in a phospho-dependent manner and are substrates of Plk1. (A) Direct binding of PBD-interacting proteins. Proteins interacting with the wild-type (WT) and mutant (MUT) PBD from nocodazole-arrested U2OS cell lysates (Figure 1B) were transferred to PVDF membrane and analyzed for direct binding by Far-Western analysis using the WT PBD as a probe. (B) Phosphorylation-dependent PBD interactions. Nocodazole-arrested U2OS cell lysates were incubated with (+) or without (−) λ-protein phosphatase before WT-PBD pull-down. The bound proteins were separated by SDS–PAGE and visualized by SYPRO Ruby staining. (C) Plk1 phosphorylation of PBD-interacting proteins. Wild-type PBD was used to pull down interacting proteins from nocodazole-arrested U2OS cell lysates. The proteins were incubated with or without active Plk1 and [γ-32P]ATP, separated by SDS–PAGE, and visualized by autoradiography.
Figure 3
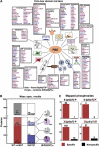
The PBD interactome. (A) Only wild-type (WT) PBD-specific or -enriched interacting proteins that contain at least one match to the optimal PBD-binding motif (S-[S/T]-P) are shown ((B), blue boxes, column 2). Proteins were categorized according to their known biological function by GO terms. Blue text indicates those proteins in which we were able to map at least one S-[pS/_pT_]-P site; dark blue indicates those that also contain an optimal Plkl phosphorylation site, whereas light blue indicates those that do not. For the remaining proteins, those shown in purple contain an optimal Plk1 (E/D)X(S/T) ϕ phosphorylation site, whereas those shown in black do not. Previously known Plk1 interactors are indicated with an asterisk. (B) Summary statistics of proteins identified by mass spectrometry from Plk1 PBD pull-down assays in nocodazole-arrested U2OS cells. Proteins were divided into three categories based on specificity for the WT versus mutant (MUT) PBD. Dark red denotes proteins that bound only to the WT PBD; light red, proteins with ⩾20-fold enhanced binding to WT PBD; dark gray, proteins with <20-fold enhanced binding to WT PBD. The presence of optimal PBD-binding S-[S/T]-P motifs is shown by dark and light blue and gray filled bars in the second column. White boxes in the second column correspond to identified interacting proteins that do not contain the optimal PBD-binding motif. Potential Plk1 (E/D)X(S/T)ϕ phosphorylation sites are indicated by purple and gray wedges in pie charts. (C) A subset of phosphorylation sites in the WT specific/enriched versus nonspecific PBD-interacting proteins were mapped by mass spectrometry. Mapped sites were categorized into those that matched the optimal PBD-binding motif (S-[_pS/pT_]-P), the minimal peptide PBD-binding motif (S-[_pS/pT_]), the minimal cyclin-dependent kinase phosphorylation motif ([_pS/pT_]-P), or none of the above ([_pS/pT_]).
Figure 4
A data-driven Plk1-related cytokinesis network. Circle color coding: orange, Plk1; red, myosin activation network; blue, actin dynamics network; light purple, proteins bridging the actin and myosin networks; dark purple, central spindle organization network; green, proteins not known to function as part of any core cytokinesis network. Proteins are labeled using HUGO gene nomenclature except for actin, tubulin, myosin, and myosin light chains. Myosin phosphatase is shown generically as a node labeled MYPT (official gene symbol for the protein we identified is PPP1R12A). Lines indicate direct protein–protein interactions, arrows indicate a kinase–substrate relationship, and the filled circle between MYPT and myosin RLC indicates a phosphatase–substrate relationship. (A) The known Plk1 network of proteins that participate in cytokinesis. (B) The core cytokinesis network of central spindle organization. (C) The core cytokinesis network of myosin activation. (D) The core cytokinesis network of actin dynamics. (E) Core cytokinesis network. The networks from (A–D) are shown connected by all of the direct, experimentally verified, protein–protein interactions. The thick line between Ect2 and RhoA represents the only mechanistic connection between previously known Plk1-interacting proteins and the actomyosin cytokinesis subnetworks. (F) Plk1-centric core cytokinesis network. The network in panel (E) is redrawn with additional interactions between Plk1 and core network components as revealed by the Plk1 PBD interactome screen. Core cytokinesis network components detected in the Plk1 PBD interaction screen are shaded yellow. Red circle indicates the section of the network selected for further study. (G) A Plk1-PBD annotated cytokinesis network. A view of the core cytokinesis network expanded to include additional Plk1 PBD-interacting proteins that were detected in our screen and are known to participate in protein–protein interactions with one or more of the core cytokinesis components. Yellow shading indicates PBD-interacting proteins in the core network; green shading indicates PBD-interacting proteins that also interact with proteins in the core network; thick black lines denote interactions between core network proteins and the additional Plk1 PBD-interacting proteins in the expanded network. (H) Proteins within the red circled region from panel (F) were investigated as in Supplementary Figure S1.
Figure 5
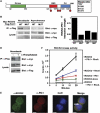
Plk1 and RhoA synergistically activate Rock2. (A) Domain structure of Rock2, with amino-acid sequence indicated below. Plk1-dependent phosphorylation sites were mapped by mass spectrometry and are indicated by filled red circles. (B) Plk1 and Rock2 interact in cells during mitosis. Full-length myc-tagged Rock2 and Flag-tagged Plk1 (containing wild-type (WT) or mutant (MUT) PBD) were expressed in U2OS cells. Lysates from asynchronous cells or following mitotic arrest with nocodazole were immunoprecipitated using M2 α-Flag beads, and immunoblotted for myc as shown. Note that expression of the MUT Plk1 was much higher than the WT Plk1 as expected, as overexpression of WT Plk1 is somewhat toxic to cells (Mundt et al, 1997; Jang et al, 2002). (C) The amount of Rock2 co-precipitating with Plk1 in (B) was quantified by normalization relative to the level of Rock2 expression. (D) Rock2 binding to Plk1 in mitosis is phosphorylation-dependent. Myc-tagged Rock2 and Flag-tagged Plk1 were coexpressed in U2OS cells. Mitotic lysates were prepared from nocodazole-arrested cells, treated for 2 h with λ protein-phosphatase or mock treated, and then immunoprecipitated using M2 α-Flag beads and immunoblotted for myc. (E) Rock2 and Plk1 colocalize at the midbody during cytokinesis. U2OS cells were released from a nocodazole block, and fixed and1 h later stained for endogenous Plk1 and Rock2. DNA was stained with DAPI. Deconvolution images are shown. Scale bars=5 μm. (F) Plk1 and RhoA synergize to amplify Rock2 kinase activity. Myc-Rock2 was immunoprecipitated from asynchronous cells and kinase activity against a myosin light chain peptide assayed in the presence or absence of RhoA and/or in response to Rock2 phosphorylation by Plk1. Error bars represent the s.d. of three independent experiments.
Figure 6
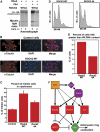
Plk1 activates Rock2 in cells. (A) Myc-Rock2 or myc-Rock2-4A was immunoprecipitated from asynchronous cells. Each IP was split in half and one-half has preincubated with Plk1 for 60 min in the presence of cold ATP. Following additional washing, Rock2 kinase activity against myosin regulatory light chain was assayed in the presence of RhoA and [γ-32P]ATP, and analyzed by SDS–PAGE/autoradiography. A strong Rock2 autophosphorylation band is also present. Lanes 1 and 2 in the left panel and lanes 3 and 4 in the right panel are each from the same gel and autoradiograph allowing direct comparison. (B) Overexpression of Rock2 causes accumulation of cells in terminal cytokinesis. Asynchronous U2OS cells were transfected with pEF-BOS (control) or pEF-BOS-expressing wild-type Rock2. Mitotic cells from the control transfections displayed a normal rounded-up morphology, whereas many of the mitotic cells overexpressing Rock2 appeared to be in the terminal midbody stage of cytokinesis. Scale bars=10 μm. (C) Percentage of mitotic cells in cytokinesis 24 h after transfection with myc-Rock2, myc-Rock2-4A, or control vectors. Mean values and s.d. from _n_=3 experiments. (D) FACS profiles of cells 72 h after transfection with myc-Rock2 or myc-Rock2-4A. (E) Percentage of cells containing greater than 4N DNA content from FACS profiles above. These results are representative of _n_=3 independent experiments. (F) A model of Plk1 control of regulatory myosin light chain (RMLC) phosphorylation during cytokinesis. Arrows indicate activation events and bars indicate inhibition events. Kinases are indicated as squares, phosphatases as circles, GEFs as diamonds, and small G-proteins as rounded squares.
Similar articles
- Cytokinesis and cancer: Polo loves ROCK'n' Rho(A).
Li J, Wang J, Jiao H, Liao J, Xu X. Li J, et al. J Genet Genomics. 2010 Mar;37(3):159-72. doi: 10.1016/S1673-8527(09)60034-5. J Genet Genomics. 2010. PMID: 20347825 Review. - Identification of potential Plk1 targets in a cell-cycle specific proteome through structural dynamics of kinase and Polo box-mediated interactions.
Bibi N, Parveen Z, Rashid S. Bibi N, et al. PLoS One. 2013 Aug 15;8(8):e70843. doi: 10.1371/journal.pone.0070843. eCollection 2013. PLoS One. 2013. PMID: 23967120 Free PMC article. - Phosphorylation of the cytokinesis regulator ECT2 at G2/M phase stimulates association of the mitotic kinase Plk1 and accumulation of GTP-bound RhoA.
Niiya F, Tatsumoto T, Lee KS, Miki T. Niiya F, et al. Oncogene. 2006 Feb 9;25(6):827-37. doi: 10.1038/sj.onc.1209124. Oncogene. 2006. PMID: 16247472 - Polo-like kinase 1 regulates RhoA during cytokinesis exit in human cells.
Dai BN, Yang Y, Chau Z, Jhanwar-Uniyal M. Dai BN, et al. Cell Prolif. 2007 Aug;40(4):550-7. doi: 10.1111/j.1365-2184.2007.00447.x. Cell Prolif. 2007. PMID: 17635521 Free PMC article. - Polo on the Rise-from Mitotic Entry to Cytokinesis with Plk1.
Petronczki M, Lénárt P, Peters JM. Petronczki M, et al. Dev Cell. 2008 May;14(5):646-59. doi: 10.1016/j.devcel.2008.04.014. Dev Cell. 2008. PMID: 18477449 Review.
Cited by
- Tubulin polymerization promoting protein 1 (Tppp1) phosphorylation by Rho-associated coiled-coil kinase (rock) and cyclin-dependent kinase 1 (Cdk1) inhibits microtubule dynamics to increase cell proliferation.
Schofield AV, Gamell C, Suryadinata R, Sarcevic B, Bernard O. Schofield AV, et al. J Biol Chem. 2013 Mar 15;288(11):7907-7917. doi: 10.1074/jbc.M112.441048. Epub 2013 Jan 25. J Biol Chem. 2013. PMID: 23355470 Free PMC article. - Phosphorylation of SAF-A/hnRNP-U Serine 59 by Polo-Like Kinase 1 Is Required for Mitosis.
Douglas P, Ye R, Morrice N, Britton S, Trinkle-Mulcahy L, Lees-Miller SP. Douglas P, et al. Mol Cell Biol. 2015 Aug;35(15):2699-713. doi: 10.1128/MCB.01312-14. Epub 2015 May 18. Mol Cell Biol. 2015. PMID: 25986610 Free PMC article. - Cell cycle regulation of Rho signaling pathways.
David M, Petit D, Bertoglio J. David M, et al. Cell Cycle. 2012 Aug 15;11(16):3003-10. doi: 10.4161/cc.21088. Epub 2012 Jul 24. Cell Cycle. 2012. PMID: 22825247 Free PMC article. Review. - PLK1 and its substrate MISP facilitate intrahepatic cholangiocarcinoma progression by promoting lymphatic invasion and impairing E-cadherin adherens junctions.
Pan YR, Lai JC, Huang WK, Peng PH, Jung SM, Lin SH, Chen CP, Wu CE, Hung TH, Yu AL, Wu KJ, Yeh CN. Pan YR, et al. Cancer Gene Ther. 2024 Feb;31(2):322-333. doi: 10.1038/s41417-023-00705-z. Epub 2023 Dec 6. Cancer Gene Ther. 2024. PMID: 38057358 Free PMC article. - Dissecting protein interactions during cytokinesis.
Ebrahimi S, Gregory SL. Ebrahimi S, et al. Commun Integr Biol. 2011 Mar;4(2):243-4. doi: 10.4161/cib.4.2.14751. Commun Integr Biol. 2011. PMID: 21655452 Free PMC article.
References
- Ahonen LJ, Kallio MJ, Daum JR, Bolton M, Manke IA, Yaffe MB, Stukenberg PT, Gorbsky GJ (2005) Polo-like kinase 1 creates the tension-sensing 3F3/2 phosphoepitope and modulates the association of spindle-checkpoint proteins at kinetochores. Curr Biol 15: 1078–1089 - PubMed
- Barr FA, Sillje HH, Nigg EA (2004) Polo-like kinases and the orchestration of cell division. Nat Rev Mol Cell Biol 5: 429–440 - PubMed
- Beausoleil SA, Villen J, Gerber SA, Rush J, Gygi SP (2006) A probability-based approach for high-throughput protein phosphorylation analysis and site localization. Nat Biotechnol 24: 1285–1292 - PubMed
- Brar GA, Kiburz BM, Zhang Y, Kim JE, White F, Amon A (2006) Rec8 phosphorylation and recombination promote the step-wise loss of cohesins in meiosis. Nature 441: 532–536 - PubMed
Publication types
MeSH terms
Substances
Grants and funding
- R01 GM060594/GM/NIGMS NIH HHS/United States
- GM60594/GM/NIGMS NIH HHS/United States
- P50-CA112962/CA/NCI NIH HHS/United States
- U54 CA112962/CA/NCI NIH HHS/United States
- WT_/Wellcome Trust/United Kingdom
LinkOut - more resources
Full Text Sources
Molecular Biology Databases
Miscellaneous


