Risk maps for the spread of highly pathogenic avian influenza in poultry - PubMed (original) (raw)
Risk maps for the spread of highly pathogenic avian influenza in poultry
Gert Jan Boender et al. PLoS Comput Biol. 2007.
Abstract
Devastating epidemics of highly contagious animal diseases such as avian influenza, classical swine fever, and foot-and-mouth disease underline the need for improved understanding of the factors promoting the spread of these pathogens. Here the authors present a spatial analysis of the between-farm transmission of a highly pathogenic H7N7 avian influenza virus that caused a large epidemic in The Netherlands in 2003. The authors developed a method to estimate key parameters determining the spread of highly transmissible animal diseases between farms based on outbreak data. The method allows for the identification of high-risk areas for propagating spread in an epidemiologically underpinned manner. A central concept is the transmission kernel, which determines the probability of pathogen transmission from infected to uninfected farms as a function of interfarm distance. The authors show how an estimate of the transmission kernel naturally provides estimates of the critical farm density and local reproduction numbers, which allows one to evaluate the effectiveness of control strategies. For avian influenza, the analyses show that there are two poultry-dense areas in The Netherlands where epidemic spread is possible, and in which local control measures are unlikely to be able to halt an unfolding epidemic. In these regions an epidemic can only be brought to an end by the depletion of susceptible farms by infection or massive culling. The analyses provide an estimate of the spatial range over which highly pathogenic avian influenza viruses spread between farms, and emphasize that control measures aimed at controlling such outbreaks need to take into account the local density of farms.
Conflict of interest statement
Competing interests. The authors have declared that no competing interests exist.
Figures
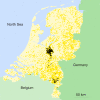
Figure 1. Map of The Netherlands Indicating the Physical Locations of All 5,360 Commercial Poultry Farms
Farms that were infected during the 2003 epidemic of avian influenza are represented by black dots, and farms that were not infected are represented by yellow dots.
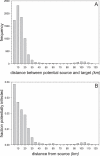
Figure 2. Distance Distribution of Potential Transmission Events
(A) The frequency distribution of the distances of potential infection events. Notice that the majority of potential infections occur within a radius of 25 km around an infected farm. (B) The proportion of farms infected within different distance categories from a potential source farm, averaged over all possible source farms (i.e., over all farms confirmed positive during the 2003 epidemic).
Figure 3. The Transmission Kernel as a Function of Interfarm Distance for the Parameter Estimates of Table 1
The 95% confidence areas of the transmission kernel are represented by the shaded area.
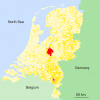
Figure 4. High-Risk Areas for Epidemic Spread of Avian Influenza Virus Based on the Transmission Kernel of Figure 3
See Table 1 for parameter estimates. For each farm, an individual reproduction number Ri is calculated on the basis of Equation 5. Infected farms with Ri < 1 infect, on average, less than one susceptible farm and pose no risk for epidemic spread (yellow dots). Infected farms with _Ri_ > 1 are expected to infect more than one susceptible farm in the early stage of an epidemic and thus constitute a risk of epidemic spread (red dots). Pink dots represent farms with Ri < 1 for the maximum likelihood estimate of the transmission kernel, but with _Ri_ > 1 for the upper boundary of the 95% kernel confidence area (Figure 3). Note that most of the farms that were infected during the epidemic in The Netherlands in 2003 (Figure 1) are classified as high-risk farms.
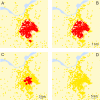
Figure 5. High-Risk Areas for Epidemic Spread for Various Local Culling Strategies in the Central High-Risk Area of The Netherlands
(A) Results for the default scenario (no culling). (B) Results for a scenario with immediate culling of all farms within a range of 1 km around an infected farm. (C,D) Culling is carried out in a range of 3 km and 5 km around infected farms, respectively. Farms in yellow pose no risk of epidemic spread for the chosen control strategy, while farms in red constitute a risk of epidemic spread even with the control strategy in place.
Similar articles
- The role of backyard poultry flocks in the epidemic of highly pathogenic avian influenza virus (H7N7) in the Netherlands in 2003.
Bavinck V, Bouma A, van Boven M, Bos ME, Stassen E, Stegeman JA. Bavinck V, et al. Prev Vet Med. 2009 Apr 1;88(4):247-54. doi: 10.1016/j.prevetmed.2008.10.007. Prev Vet Med. 2009. PMID: 19178969 - Genetic data provide evidence for wind-mediated transmission of highly pathogenic avian influenza.
Ypma RJ, Jonges M, Bataille A, Stegeman A, Koch G, van Boven M, Koopmans M, van Ballegooijen WM, Wallinga J. Ypma RJ, et al. J Infect Dis. 2013 Mar 1;207(5):730-5. doi: 10.1093/infdis/jis757. Epub 2012 Dec 10. J Infect Dis. 2013. PMID: 23230058 - Avian influenza A virus (H7N7) epidemic in The Netherlands in 2003: course of the epidemic and effectiveness of control measures.
Stegeman A, Bouma A, Elbers AR, de Jong MC, Nodelijk G, de Klerk F, Koch G, van Boven M. Stegeman A, et al. J Infect Dis. 2004 Dec 15;190(12):2088-95. doi: 10.1086/425583. Epub 2004 Nov 15. J Infect Dis. 2004. PMID: 15551206 - Intra- and interspecies transmission of H7N7 highly pathogenic avian influenza virus during the avian influenza epidemic in The Netherlands in 2003.
de Jong MC, Stegeman A, van der Goot J, Koch G. de Jong MC, et al. Rev Sci Tech. 2009 Apr;28(1):333-40. doi: 10.20506/rst.28.1.1859. Rev Sci Tech. 2009. PMID: 19618636 Review. - [Avian influenza: eradication from commercial poultry is still not in sight].
Landman WJ, Schrier CC. Landman WJ, et al. Tijdschr Diergeneeskd. 2004 Dec 1;129(23):782-96. Tijdschr Diergeneeskd. 2004. PMID: 15624878 Review. Dutch.
Cited by
- Cost analysis of various low pathogenic avian influenza surveillance systems in the Dutch egg layer sector.
Rutten N, Gonzales JL, Elbers AR, Velthuis AG. Rutten N, et al. PLoS One. 2012;7(4):e33930. doi: 10.1371/journal.pone.0033930. Epub 2012 Apr 16. PLoS One. 2012. PMID: 22523543 Free PMC article. - Pathogenic landscapes: interactions between land, people, disease vectors, and their animal hosts.
Lambin EF, Tran A, Vanwambeke SO, Linard C, Soti V. Lambin EF, et al. Int J Health Geogr. 2010 Oct 27;9:54. doi: 10.1186/1476-072X-9-54. Int J Health Geogr. 2010. PMID: 20979609 Free PMC article. - Phylodynamic analysis and evaluation of the balance between anthropic and environmental factors affecting IBV spreading among Italian poultry farms.
Franzo G, Tucciarone CM, Moreno A, Legnardi M, Massi P, Tosi G, Trogu T, Ceruti R, Pesente P, Ortali G, Gavazzi L, Cecchinato M. Franzo G, et al. Sci Rep. 2020 Apr 29;10(1):7289. doi: 10.1038/s41598-020-64477-4. Sci Rep. 2020. PMID: 32350378 Free PMC article. - Epidemic Reconstruction in a Phylogenetics Framework: Transmission Trees as Partitions of the Node Set.
Hall M, Woolhouse M, Rambaut A. Hall M, et al. PLoS Comput Biol. 2015 Dec 30;11(12):e1004613. doi: 10.1371/journal.pcbi.1004613. eCollection 2015 Dec. PLoS Comput Biol. 2015. PMID: 26717515 Free PMC article. - Evidence-based controls for epidemics using spatio-temporal stochastic models in a Bayesian framework.
Adrakey HK, Streftaris G, Cunniffe NJ, Gottwald TR, Gilligan CA, Gibson GJ. Adrakey HK, et al. J R Soc Interface. 2017 Nov;14(136):20170386. doi: 10.1098/rsif.2017.0386. J R Soc Interface. 2017. PMID: 29187634 Free PMC article.
References
- Thompson D, Muriel P, Russell D, Osborne P, Bromley A, et al. Economic costs of the foot and mouth disease outbreak in the United Kingdom in 2001. Rev Sci Tech. 2002;21:675–687. - PubMed
- Anthony R. Risk communication, value judgments, and the public-policy maker relationship in a climate of public sensitivity toward animals: Revisiting Britain's foot and mouth crisis. J Agric Environ Ethics. 2004;17:363–383.
- Koopmans M, Wilbrink B, Conyn M, Natrop G, van der Nat H, et al. Transmission of H7N7 avian influenza A virus to human beings during a large outbreak in commercial poultry farms in The Netherlands. Lancet. 2004;363:587–593. - PubMed
- Ferguson NM, Cummings DAT, Cauchemez S, Fraser C, Riley S, et al. Strategies for containing an emerging influenza pandemic in Southeast Asia. Nature. 2005;437:209–214. - PubMed
Publication types
MeSH terms
LinkOut - more resources
Full Text Sources
Medical


