The MAPK(ERK-1,2) pathway integrates distinct and antagonistic signals from TGFalpha and FGF7 in morphogenesis of mouse mammary epithelium - PubMed (original) (raw)
The MAPK(ERK-1,2) pathway integrates distinct and antagonistic signals from TGFalpha and FGF7 in morphogenesis of mouse mammary epithelium
Jimmie E Fata et al. Dev Biol. 2007.
Abstract
Transforming growth factor-alpha (TGFalpha) and fibroblast growth factor-7 (FGF7) exhibit distinct expression patterns in the mammary gland. Both factors signal through mitogen-activated kinase/extracellular regulated kinase-1,2 (MAPK(ERK1,2)); however, their unique and/or combined contributions to mammary morphogenesis have not been examined. In ex vivo mammary explants, we show that a sustained activation of MAPK(ERK1,2) for 1 h, induced by TGFalpha, was necessary and sufficient to initiate branching morphogenesis, whereas a transient activation (15 min) of MAPK(ERK1,2), induced by FGF7, led to growth without branching. Unlike TGFalpha, FGF7 promoted sustained proliferation as well as ectopic localization of, and increase in, keratin-6 expressing cells. The response of the explants to FGF10 was similar to that to FGF7. Simultaneous stimulation by FGF7 and TGFalpha indicated that the FGF7-induced MAPK(ERK1,2) signaling and associated phenotypes were dominant: FGF7 may prevent branching by suppression of two necessary TGFalpha-induced morphogenetic effectors, matrix metalloproteinase-3 (MMP-3/stromelysin-1), and fibronectin. Our findings indicate that expression of morphogenetic effectors, proliferation, and cell-type decisions during mammary organoid morphogenesis are intimately dependent on the duration of activation of MAPK(ERK1,2) activation.
Figures
Fig. 1
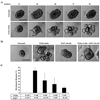
Organoid response to TGFα and FGF7. (A) Untreated organoids fail to undergo major morphological changes, except a slight lumen expansion followed by compression from 48 to 60 h. In contrast, TGFα stimulation initiates bud formation (arrows) within 48 h, with the majority of morphogenesis occurring within the 48- to 72-h window. Images represent frames taken from movies (Supplemental Movies 1 and 2). (B, C) FGF7 fails to induce branching morphogenesis and suppresses TGFα-induced morphogenesis in a dose-dependent manner. Please see Supplemental Movies 3 and 4. (C) Morphometric analysis of branching morphogenesis. Scale bars represent 100 µm. Data are represented as mean morphogenetic response±standard deviation (SD) and involve counting at least 100 organoids per condition per experiment.
Fig. 2
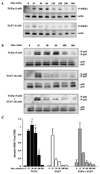
FGF7 attenuates TGFα-induced MAPKERK1,2 activation. (A, B) Activation of high MEK1 (P-MEK1) and MAPKERK1,2 (P-p44, P-p42) levels are sustained for 1 h in organoids stimulated with TGFα compared to only 15 min in organoids stimulated with FGF7. Actin and total MAPKERK1,2 (p44, p42) are provided as loading controls. (B) FGF7 attenuates TGFα activation of MAPKERK1,2 when the growth factors are added simultaneously to the organoids. (C) Quantitative analysis of MAPKERK1,2 activation: MAPKERK1,2 activation in organoids treated with TGFα is significantly different than those treated with FGF7 *[ p <0.05], or those treated with FGF7 plus TGFα at 30, 60, and 180 min. Data are represented as the mean of phospho-MAPKERK1,2 levels/total MAPKERK1,2 ±standard deviation (SD).
Fig. 3
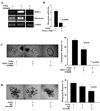
One hour of MAPKERK1,2 activation is necessary and sufficient for TGFα-induced morphogenesis. (A) TGFα induces a rapid increase in active MAPKERK1,2 activation. PD98059, the MEK inhibitor, suppresses TGFα-induced MAPKERK1,2 activation when added 1 h before TGFα stimulation. Active MAPKERK1,2 (P-p44/P-p42) and total MAPKERK1,2 (p44/p42) were visualized on the same membrane in each condition. Membranes were transferred and developed simultaneously. (B) (a) TGFα alone. Pre-treatment with PD98059 for 1 h (b), or simultaneous addition with TGFα at time 0 h (c), completely inhibits morphogenesis (see the Supplemental Movie 5). Addition of PD98059 at 1 h (d) or 4 h (not shown) after TGFα treatment fails to inhibit morphogenesis completely. (C) Quantification of the percentage of organoids undergoing a morphogenetic response similar to TGFα-treated samples (a=untreated, b=PD98059 pre-treatment followed by TGFα, c=TGFα+PD98059 added simultaneously, d=PD98059 added after 1 h of TGFα stimulation, e=PD98059 added after 4 h of TGFα stimulation). Scale bar equals 50 µm. Data are represented as mean morphogenetic response±SD and involve counting at least 100 organoids per condition per experiment.
Fig. 4
Inhibition of MMP-3 activity and fibronectin adhesion alters TGFα-induced morphogenesis. (A) TGFα induces MAPKERK1,2-dependent mRNA expression of MMP-3 and fibronectin. (B) FGF7 inhibits TGFα-induced expression of fibronectin mRNA levels (quantitative PCR). Data are represented as the mean ratio of fibronectin mRNA/18s±SD. (C) A peptide-based inhibitor specific to MMP-3 (20 µM) or the general metalloproteinase inhibitor, GM6001 (40 µM) suppresses morphogenesis and often leads to formation of cyst-like structures. (D) Addition of a blocking antibody (2 µg/ml) against the fibronectin receptor, α5β1 integrin alters morphogenesis, while a non-specific isotype IgG antibody (2 µg/ml) has no effect. Quantification represents the percentage of structures undergoing morphogenesis under different conditions. Data are represented as mean morphogenetic response±SD and involve counting at least 100 organoids per condition per experiment. Scale bars in panels C and D equal 200 µm.
Fig. 5
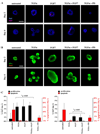
MAPKERK1,2 regulates organoid proliferation and apoptosis. (A) TGFα-induced proliferation (determined by Ki67 immunocytochemistry with DAPI counter stain for nuclei) is inhibited by PD98059 but augmented by FGF7. (B) Live cells are labeled with the vital dye Calcein AM (green) and dead cells are labeled with ethidium homodimer-1 (orange). Dead cells are prevalent in untreated and PD98059-treated organoids. (C) Organoids treated with FGF7 show continued proliferation on day 4. (C) TGFα plus PD98059-treated and control organoids analyzed at day 2 or day 4 have significantly higher apoptosis than those treated with TGFα or FGF7. *Significantly different than all other conditions. Scale bars equal 50 µm. Data are represented as mean percent Ki67±SD and mean percent apoptosis±SD and involve counting at least 10 randomly selected organoids per condition per experiment.
Fig. 6
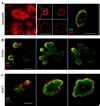
Orientation of myoepithelial and epithelial cells is maintained in organoids undergoing morphogenesis. Indirect immunofluorescence for K14 (red; myoepithelium) and K8 (green; epithelium) in cultured organoids was captured by confocal microscopy. (A–C) Epithelial cells are the small tightly packed cuboidal cells. Myoepithelial cells are the larger cells displaying membrane extensions; they retain their basal orientation with respect to epithelial cells. (A) Untreated organoids, day 4. (B) TGFα-treated organoids, day 4. (C) FGF7-treated organoids, day 4. A montage of merged K8/K14 confocal stacks is represented in panels B and C and indicate that cells at the distal ends of branches in panel B are K8/K14 double positive (yellow signal). Lumena (*) are evident in all structures treated with TGFα or FGF7. Scale bars in panel A equal 5 µm (left panel) and 50 µm (right panels). Scale bars in panels B and C equal 50 µm.
Fig. 7
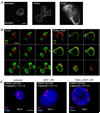
FGF7 induces MAPKERK1,2-dependent increase in K6-positive cells as well as organoid proliferation. (A) FGF7-induced K6-positive cells are evident on the outside of the organoid (day 4). (B) K6-positive cells in TGFα-treated organoids remain at the base of the branch, while K6-positive cells in FGF7-treated organoids are found both encapsulating and within the organoid. Some of these K6-positive cells are K8/K6 double positive (yellow). (C) FGF7-induced proliferation and increase in K6-positive cells is dependent on MAPKERK1,2 activation. Scale bar in panel A equals 25 µm, in panel B equals 100 µm, and in panel C equals 25 µm.
Similar articles
- Connexin 43 Is Necessary for Salivary Gland Branching Morphogenesis and FGF10-induced ERK1/2 Phosphorylation.
Yamada A, Futagi M, Fukumoto E, Saito K, Yoshizaki K, Ishikawa M, Arakaki M, Hino R, Sugawara Y, Ishikawa M, Naruse M, Miyazaki K, Nakamura T, Fukumoto S. Yamada A, et al. J Biol Chem. 2016 Jan 8;291(2):904-12. doi: 10.1074/jbc.M115.674663. Epub 2015 Nov 12. J Biol Chem. 2016. PMID: 26565022 Free PMC article. - Intracellular pH regulation by Na⁺/H⁺ exchanger-1 (NHE1) is required for growth factor-induced mammary branching morphogenesis.
Jenkins EC Jr, Debnath S, Gundry S, Gundry S, Uyar U, Fata JE. Jenkins EC Jr, et al. Dev Biol. 2012 May 1;365(1):71-81. doi: 10.1016/j.ydbio.2012.02.010. Epub 2012 Feb 17. Dev Biol. 2012. PMID: 22366186 - Fibroblast growth factors 7 and 10 are involved in ameloblastoma proliferation via the mitogen-activated protein kinase pathway.
Nakao Y, Mitsuyasu T, Kawano S, Nakamura N, Kanda S, Nakamura S. Nakao Y, et al. Int J Oncol. 2013 Nov;43(5):1377-84. doi: 10.3892/ijo.2013.2081. Epub 2013 Aug 29. Int J Oncol. 2013. PMID: 24002438 Free PMC article. - Roles of transforming growth factor-alpha in mammary development and disease.
Booth BW, Smith GH. Booth BW, et al. Growth Factors. 2007 Aug;25(4):227-35. doi: 10.1080/08977190701750698. Growth Factors. 2007. PMID: 18092231 Review.
Cited by
- The hemopexin domain of MMP3 is responsible for mammary epithelial invasion and morphogenesis through extracellular interaction with HSP90β.
Correia AL, Mori H, Chen EI, Schmitt FC, Bissell MJ. Correia AL, et al. Genes Dev. 2013 Apr 1;27(7):805-17. doi: 10.1101/gad.211383.112. Genes Dev. 2013. PMID: 23592797 Free PMC article. - A Mammary Organoid Model to Study Branching Morphogenesis.
Caruso M, Huang S, Mourao L, Scheele CLGJ. Caruso M, et al. Front Physiol. 2022 Mar 16;13:826107. doi: 10.3389/fphys.2022.826107. eCollection 2022. Front Physiol. 2022. PMID: 35399282 Free PMC article. - The Par3/aPKC interaction is essential for end bud remodeling and progenitor differentiation during mammary gland morphogenesis.
McCaffrey LM, Macara IG. McCaffrey LM, et al. Genes Dev. 2009 Jun 15;23(12):1450-60. doi: 10.1101/gad.1795909. Genes Dev. 2009. PMID: 19528321 Free PMC article. - Mammary morphogenesis and regeneration require the inhibition of EMT at terminal end buds by Ovol2 transcriptional repressor.
Watanabe K, Villarreal-Ponce A, Sun P, Salmans ML, Fallahi M, Andersen B, Dai X. Watanabe K, et al. Dev Cell. 2014 Apr 14;29(1):59-74. doi: 10.1016/j.devcel.2014.03.006. Dev Cell. 2014. PMID: 24735879 Free PMC article. - FGF ligands of the postnatal mammary stroma regulate distinct aspects of epithelial morphogenesis.
Zhang X, Martinez D, Koledova Z, Qiao G, Streuli CH, Lu P. Zhang X, et al. Development. 2014 Sep;141(17):3352-62. doi: 10.1242/dev.106732. Epub 2014 Jul 30. Development. 2014. PMID: 25078648 Free PMC article.
References
- Atwood CS, Hovey RC, Glover JP, Chepko G, Ginsburg E, Robison WG, Vonderhaar BK. Progesterone induces side-branching of the ductal epithelium in the mammary glands of peripubertal mice. J. Endocrinol. 2000;167:39–52. - PubMed
- Ballif BA, Blenis J. Molecular mechanisms mediating mammalian mitogen-activated protein kinase (MAPK) kinase (MEK)-MAPK cell survival signals. Cell Growth Differ. 2001;12:397–408. - PubMed
- Cabernard C, Affolter M. Distinct roles for two receptor tyrosine kinases in epithelial branching morphogenesis in Drosophila. Dev. Cell. 2005;9:831–842. - PubMed
- Coleman-Krnacik S, Rosen JM. Differential temporal and spatial gene expression of fibroblast growth factor family members during mouse mammary gland development. Mol. Endocrinol. 1994;8:218–229. - PubMed
Publication types
MeSH terms
Substances
Grants and funding
- U01 ES012801-04S3/ES/NIEHS NIH HHS/United States
- R01 CA057621-13/CA/NCI NIH HHS/United States
- R01 CA057621-12/CA/NCI NIH HHS/United States
- ES012801/ES/NIEHS NIH HHS/United States
- R01 CA057621-11/CA/NCI NIH HHS/United States
- R01 CA057621-15/CA/NCI NIH HHS/United States
- HL-007731/HL/NHLBI NIH HHS/United States
- U01 ES012801/ES/NIEHS NIH HHS/United States
- T32 HL007731/HL/NHLBI NIH HHS/United States
- R01 CA057621-14/CA/NCI NIH HHS/United States
- R01 CA057621/CA/NCI NIH HHS/United States
- CA57621/CA/NCI NIH HHS/United States
LinkOut - more resources
Full Text Sources
Miscellaneous
