Zfx controls the self-renewal of embryonic and hematopoietic stem cells - PubMed (original) (raw)
Zfx controls the self-renewal of embryonic and hematopoietic stem cells
Jose M Galan-Caridad et al. Cell. 2007.
Abstract
Stem cells (SC) exhibit a unique capacity for self-renewal in an undifferentiated state. It is unclear whether the self-renewal of pluripotent embryonic SC (ESC) and of tissue-specific adult SC such as hematopoietic SC (HSC) is controlled by common mechanisms. The deletion of transcription factor Zfx impaired the self-renewal but not the differentiation capacity of murine ESC; conversely, Zfx overexpression facilitated ESC self-renewal by opposing differentiation. Furthermore, Zfx deletion abolished the maintenance of adult HSC but did not affect erythromyeloid progenitors or fetal HSC. Zfx-deficient ESC and HSC showed increased apoptosis and SC-specific upregulation of stress-inducible genes. Zfx directly activated common target genes in ESC and HSC, as well as ESC-specific target genes including ESC self-renewal regulators Tbx3 and Tcl1. These studies identify Zfx as a shared transcriptional regulator of ESC and HSC, suggesting a common genetic basis of self-renewal in embryonic and adult SC.
Figures
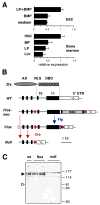
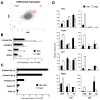
Figure 1. The expression analysis and conditional targeting of Zfx
(A) The expression of Zfx is elevated in undifferentialed murine ESC and HSC. The ESC were grown in serum-free culture with LIF+BMP4 (undifferentiated), BMP4 or medium alone (differentiated). Wild-type BM was sorted into lineage-positive (Lin+) differentiated cells and Lin− populations including HSC (Sca-1+ c-Kit+), myeloid progenitors (MP, Sca-1− c-Kit+) and lymphoid progenitors (LP, Sca-1low c-Kitlow). Shown is normalized Zfx expression relative to the corresponding SC sample as measured by qPCR. (B) The strategy of Zfx gene targeting. Exons 10 and 11 encoding the NLS and DBD of Zfx protein were flanked by LoxP sites (red triangles). The neomycin resistance (neo) cassette flanked by FRT sites (blue triangles) was excised from the targeted Zfxflox-neo allele by Flp-mediated recombination. Cre-mediated recombination of either Zfxflox-neo or Zfxflox allele produces the Zfxnull allele. (C) The expression of Zfx protein in the wild-type (wt) or targeted ESC clones, analyzed by Western blotting with antibodies against Zfx N-terminal AD. The positions of full-length Zfx and of the predicted protein encoded by the null allele (determined using the corresponding epitope-tagged expression constructs) are indicated by filled and open triangles, respectively.
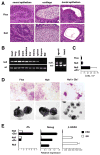
Figure 2. Defective self-renewal of Zfx-deficient ESC
(A) Impaired competitive growth of Zfx-deficient ESC but not of differentiated cells. Cre recombination was transiently induced in ESC or in primary embryonic fibroblasts (MEF), and the presence of Zfxnull cells at subsequent passages (P) was monitored by genomic PCR. The ESC were grown in serum/LIF/feeders (undiff.) or differentiated (diff.) into primitive embryoid bodies (EB) followed by adherent culture (A). Shown are the simultaneous amplification of Zfxnull and Zfxflox alleles and the ratios of separately amplified alleles determined by qPCR. (B) Re-expression of Zfx in Zfx-deficient ESC. Zfxnull ESC stably transfected with Zfx or control constructs (ctrl) were analyzed by Western blotting with anti-Zfx Ab. The clones overexpressing Zfx are indicated with an asterisk. (C) Defective colony morphology of Zfx-deficient ESC. Shown are live cultures (magnification 100x) and fixed cells stained for alkaline phosphatase (purple, magnification 200x) of ESC grown with serum/LIF/feeders. (D) Defective growth and colony forming capacity of Zfx-deficient ESC clones in serum/LIF/feeders. Shown are numbers of colonies and total cell yields of ESC (average ± S.D. of triplicate cultures) after one passage at single-cell (102/well) or regular (104/well) densities, respectively. (E) Increased apoptosis of Zfx-deficient ESC clones grown in serum/LIF, as measured by DNA laddering assay (two clones per genotype). (F) Defective growth of Zfx-deficient ESC clones in serum-free culture with LIF+BMP4. The data represent average cell yields of parallel triplicate cultures for each clone. (G) Increased apoptosis of Zfx-deficient ESC in serum-free culture. After one passage in LIF+BMP4, cells were stained for Annexin V and DNA content (7-AAD); the fraction of Annexin+ 7-AAD− apoptotic cells is indicated.
Figure 3. Normal differentiation capacity of Zfx-deficient ESC
(A) Normal teratoma formation by control (Zfxflox) and Zfxnull ESC clones (representative of two clones per genotype). Differentiated tissues in hematoxylin/eosin-stained sections of teratomas are shown (magnification 200x). (B) The contribution of Zfxnull ESC to tissues of chimeric mice. Left panel: null and wild-type Zfx alleles were separately amplified from genomic DNA of chimeric mouse tissues (representative of three chimeras). Right panel: female progeny of a chimeric mouse were genotyped, confirming germ line transmission of Zfxnull allele. (C) The growth in differentiating conditions of ESC clones lacking (Zfxnull) or overexpressing (Zfxnull+Zfx*) Zfx. Shown are average cell yields of triplicate cultures plated at 2x10⁴/well and grown for one passage without LIF or feeders. (D) The same ESC clones were grown without LIF and stained for alkaline phosphatase (purple, upper panel) or induced to form mature EB (lower panel). Magnification, 100x. (E) The expression of pluripotency (Nanog) and differentiation (β-globin) markers in undifferentiated ESC or in EB measured by qPCR relative to the expression in Zfxnull+Zfx ESC.
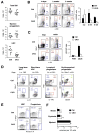
Figure 4. The loss of adult HSC after Zfx deletion in hematopoietic cells
(A) The decrease in HSC numbers after Zfx deletion from the BM. Shown are absolute numbers of total BM cells, myeloid progenitors and the HSC-containing LSK population in control and Mx1-Cre+ Zfxflox/y CKO mice two weeks after pI·C injection. Each symbol represents an individual mouse. (B) The loss of HSC from the stem/progenitor compartment of Mx1-Cre+ CKO BM at the indicated times after pI·C injection. Shown are the staining profiles of Lin− cells, with the LSK population (red) and erythromyeloid progenitors (blue) and their percentages indicated (average ± S.D. of 3–12 animals). The graph shows average ratios of the LSK to myeloid progenitor fractions. (C) The loss of adult HSC after constitutive Zfx deletion in the hematopoietic system. The HSC and myeloid progenitor populations in the fetal liver (n=6–9) or in adult BM (n=4–5) of Tie2-Cre+ CKO and control mice are shown as in panel B. (D) Decreased HSC and lymphoid progenitors but normal myeloid progenitors in Mx1-Cre+ CKO mice two weeks after pI·C injection. Shown are Flt3− and Flt3+ LSK populations containing long-term and short-term HSC, respectively; Flt3+ Lin− c-Kitlow lymphoid progenitors including the IL-7Rα+ CLP subset (red); and Lin− Sca-1− c-Kit+ erythromyeloid progenitors divided into common myeloid progenitor (red), erythrocyte/megakaryocyte progenitor (blue) and granulocyte/monocyte progenitor (green). The fraction of each subset in the Lin−population is indicated (average ± S.D. of 5 animals). (E) Increased HSC apoptosis in Mx1-Cre+ CKO mice two weeks after pI·C injection. Shown are gated HSC (the LSK subset) and erythromyeloid progenitors (Lin− Sca-1− c-Kit+) stained for Annexin V and DNA content (7-AAD). The fractions of Annexin+ 7-AAD- apoptotic cells (highlighted) are indicated (average ± S.D. of 3 animals). (F) Normal erythromyeloid progenitor function in Zfx-deficient BM. Shown is in vitro colony formation by BM cells from Mx1-Cre+ CKO or control mice two weeks after pI·C injection (average ± S.D. of 4 animals).
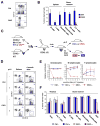
Figure 5. The loss of Zfx abolishes HSC function
(A-B) Defective hematopoietic reconstitution by Zfx-deficient BM. Control or Mx1-Cre+ CKO mice (CD45.2+) were injected with pI·C to induce Zfx deletion, and their BM was mixed with wild-type competitor BM (CD45.1+) and transferred into irradiated CD45.1+ recipients. Shown are representative staining profiles of PBL (A) and the fractions of donor-derived CD45.2+ cells in the indicated lineages (B) two months after BM transfer (average ± S.D. of 3 recipients). (C-F) The loss of HSC maintenance after Zfx deletion in pre-established BM chimeras. (C) Experimental strategy. (D) Representative staining profiles of total PBL in the recipient mice before or 6 months after pI·C injection, showing donor (CD45.2+CD45.1−, highlighted), competitor (CD45.2−CD45.1+) and residual host (CD45.2+CD45.1+) cells. (E) Relative contribution of donor-derived cells to major PBL lineages over time. The donor-derived fraction before pI·C injection (>50% in all mice) was taken as one for each recipient; the data represent average ± S.D. of 4 recipients per group. A representative of 3 independent reconstitution experiments is shown. (F) The percentage of donor-derived cells in the indicated cell subsets in the thymus and BM 6 months after pI·C injection.
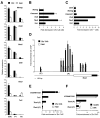
Figure 6. A common gene expression signature of Zfx-deficient ESC and HSC
(A) Genome-wide expression analysis of Zfx-deficient ESC and HSC using microarrays. Data points represent normalized increase (>0) or decrease (<0) in individual probe levels in Zfxnull ESC and HSC relative to the respective controls. Probes showing coordinated decrease or increase in Zfxnull ESC and HSC are indicated as large blue and red dots, respectively; small colored dots represent a more permissive analysis. The numbers of total and coordinately changing probes are indicated. (B) The down-regulation of common target genes in HSC and ESC after Zfx deletion. HSC were sorted from control and Mx1-Cre+ CKO BM 4 days after pI·C injection. Short-term batch cultures of Zfxnull ESC were generated by sorting Zfxflox-neo ESC transfected with Cre-GFP. The data represent fold decrease of the indicated transcripts in Zfxnull over control SC as determined by qPCR. (C) Binding of Zfx to its common target genes in ESC. ChIP using anti-epitope tag antibodies was performed on Zfxnull ESC reconstituted with tagged Zfx (Zfx-TAG) or on control Zfxnull ESC (null). The enrichment of promoter (P) or intron (I) regions of the indicated target genes in anti-tag antibody ChIP compared to control IgG ChIP was determined by qPCR. The promoter of β-actin was used as a negative control. The regulatory regions of Phca could not be reliably amplified by qPCR. (D) A common gene induction signature of Zfx-deficient ESC and HSC. The ESC include control (Zfxflox) and Zfxnull clones grown as undifferentiated cells or differentiated for 1 or 2 passages without LIF (Diff. P1–P2). The HSC (LSK population), myeloid progenitors and Lin+ cells were sorted from control and Mx1-Cre+ CKO mice 4 days after the last pI·C injection. Data represent expression levels determined by qPCR relative to the respective control SC sample (assigned an arbitrary value of 100).
Figure 7. Zfx controls Tbx3 and Tcl1 expression in ESC
(A) The expression of ESC-specific genes in Zfx-deficient ESC. Control (Zfxflox) and Zfxnull ESC clones grown in LIF or differentiated for 1 or 2 passages without LIF (P1–P2) were analyzed by qPCR. Data represent expression levels of the indicated genes relative to undifferentiated control ESC (assigned an arbitrary value of 100). (B) The expression of Tbx3 and Tcl1 in polyclonal ESC after Zfx deletion. The data represent fold decrease of the indicated genes in Zfxnull over control ESC in short-term batch cultures as determined by qPCR. (C) The expression of Tbx3 and Tcl1 in Zfx-overexpressing ESC as determined by qPCR. The data show fold increase of the indicated genes in Zfx-overexpressing ESC (Zfxnull+Zfx*, Fig. 2B) over control ESC (Zfxnull+Zfx). (D) The region of Tbx3 promoter bound by Zfx in ESC. The Zfxnull ESC reconstituted with tagged Zfx (Zfx-TAG) or control Zfxnull ESC were analyzed by ChIP as in Fig. 6C. Data represent the enrichment of different regions of Tbx3 upstream region, shown below with the 5' UTR (open box) and the first coding exon (black box). (E) The binding of Zfx to the promoter regions of Tbx3 and Tcl1 in Zfx-expressing (Zfx-TAG) and Zfx-deficient (null) ESC. Shown is fold enrichment of the control target 6720467C03Rik, Tcl1 promoter, and Tbx3 promoter (P) or distal 5' region (5') indicated in panel D. (F) Increased binding of Zfx to Tbx3 promoter in undifferentiated versus differentiated ESC. Shown is fold enrichment of control target 6720467C03Rik, Tbx3 promoter (P) or distal 5' region (5') in Zfx-expressing ESC (Zfx-TAG) grown with LIF (undiff.) or differentiated for two passages without LIF (diff.).
Comment in
- Zfx: at the crossroads of survival and self-renewal.
Cellot S, Sauvageau G. Cellot S, et al. Cell. 2007 Apr 20;129(2):239-41. doi: 10.1016/j.cell.2007.04.002. Cell. 2007. PMID: 17448983
Similar articles
- Zfx: at the crossroads of survival and self-renewal.
Cellot S, Sauvageau G. Cellot S, et al. Cell. 2007 Apr 20;129(2):239-41. doi: 10.1016/j.cell.2007.04.002. Cell. 2007. PMID: 17448983 - [Regulatory role of HOXB4 in self-renewal of hematopoietic stem cells - review].
Zheng CL, Zhou B, Lu M. Zheng CL, et al. Zhongguo Shi Yan Xue Ye Xue Za Zhi. 2007 Jun;15(3):647-51. Zhongguo Shi Yan Xue Ye Xue Za Zhi. 2007. PMID: 17605886 Review. Chinese. - ZFX controls the self-renewal of human embryonic stem cells.
Harel S, Tu EY, Weisberg S, Esquilin M, Chambers SM, Liu B, Carson CT, Studer L, Reizis B, Tomishima MJ. Harel S, et al. PLoS One. 2012;7(8):e42302. doi: 10.1371/journal.pone.0042302. Epub 2012 Aug 3. PLoS One. 2012. PMID: 22879936 Free PMC article. - Molecular functions of the LIM-homeobox transcription factor Lhx2 in hematopoietic progenitor cells derived from mouse embryonic stem cells.
Kitajima K, Kawaguchi M, Iacovino M, Kyba M, Hara T. Kitajima K, et al. Stem Cells. 2013 Dec;31(12):2680-9. doi: 10.1002/stem.1500. Stem Cells. 2013. PMID: 23922318 - Regulatory role of Klf5 in early mouse development and in embryonic stem cells.
Parisi S, Russo T. Parisi S, et al. Vitam Horm. 2011;87:381-97. doi: 10.1016/B978-0-12-386015-6.00037-8. Vitam Horm. 2011. PMID: 22127252 Review.
Cited by
- Differential expression of ZFX gene in gastric cancer.
Nikpour P, Emadi-Baygi M, Mohammad-Hashem F, Maracy MR, Haghjooy-Javanmard S. Nikpour P, et al. J Biosci. 2012 Mar;37(1):85-90. doi: 10.1007/s12038-011-9174-2. J Biosci. 2012. PMID: 22357206 - Yin Yang 1 extends the Myc-related transcription factors network in embryonic stem cells.
Vella P, Barozzi I, Cuomo A, Bonaldi T, Pasini D. Vella P, et al. Nucleic Acids Res. 2012 Apr;40(8):3403-18. doi: 10.1093/nar/gkr1290. Epub 2011 Dec 30. Nucleic Acids Res. 2012. PMID: 22210892 Free PMC article. - Pluripotency maintenance mechanism of embryonic stem cells and reprogramming.
Masui S. Masui S. Int J Hematol. 2010 Apr;91(3):360-72. doi: 10.1007/s12185-010-0517-9. Epub 2010 Feb 16. Int J Hematol. 2010. PMID: 20157790 Review. - Multiple selective sweeps of ancient polymorphisms in and around LTα located in the MHC class III region on chromosome 6.
Campbell MC, Ashong B, Teng S, Harvey J, Cross CN. Campbell MC, et al. BMC Evol Biol. 2019 Dec 2;19(1):218. doi: 10.1186/s12862-019-1516-y. BMC Evol Biol. 2019. PMID: 31791241 Free PMC article. - High expression of Zinc-finger protein X-linked promotes tumor growth and predicts a poor outcome for stage II/III colorectal cancer patients.
Yan X, Shan Z, Yan L, Zhu Q, Liu L, Xu B, Liu S, Jin Z, Gao Y. Yan X, et al. Oncotarget. 2016 Apr 12;7(15):19680-92. doi: 10.18632/oncotarget.7547. Oncotarget. 2016. PMID: 26967242 Free PMC article.
References
- Azuara V, Perry P, Sauer S, Spivakov M, Jorgensen HF, John RM, Gouti M, Casanova M, Warnes G, Merkenschlager M, Fisher AG. Chromatin signatures of pluripotent cell lines. Nat Cell Biol. 2006;8:532–538. - PubMed
- Boiani M, Scholer HR. Regulatory networks in embryo-derived pluripotent stem cells. Nat Rev Mol Cell Biol. 2005;6:872–884. - PubMed
- Boyer LA, Plath K, Zeitlinger J, Brambrink T, Medeiros LA, Lee TI, Levine SS, Wernig M, Tajonar A, Ray MK, et al. Polycomb complexes repress developmental regulators in murine embryonic stem cells. Nature. 2006;441:349–353. - PubMed
- Burdon T, Smith A, Savatier P. Signalling, cell cycle and pluripotency in embryonic stem cells. Trends Cell Biol. 2002;12:432–438. - PubMed
Publication types
MeSH terms
Substances
Grants and funding
- HL084353/HL/NHLBI NIH HHS/United States
- R01 HL084353-01/HL/NHLBI NIH HHS/United States
- R01 HL084353/HL/NHLBI NIH HHS/United States
- F31 AI066459-02/AI/NIAID NIH HHS/United States
- AI066459/AI/NIAID NIH HHS/United States
- AI007525/AI/NIAID NIH HHS/United States
- R01 AI072571/AI/NIAID NIH HHS/United States
- F31 AI066459/AI/NIAID NIH HHS/United States
- T32 AI007525/AI/NIAID NIH HHS/United States
- T32 AI007525-10/AI/NIAID NIH HHS/United States
- R21 AI085439/AI/NIAID NIH HHS/United States
LinkOut - more resources
Full Text Sources
Other Literature Sources
Medical
Molecular Biology Databases
