Genome wide copy number abnormalities in pediatric medulloblastomas as assessed by array comparative genome hybridization - PubMed (original) (raw)
Genome wide copy number abnormalities in pediatric medulloblastomas as assessed by array comparative genome hybridization
Ken C Lo et al. Brain Pathol. 2007 Jul.
Abstract
Array-based comparative genomic hybridization was used to characterize 22 medulloblastomas in order to precisely define genetic alterations in these malignant childhood brain tumors. The 17p(-)/17q(+) copy number abnormality (CNA), consistent with the formation of isochromosome 17q, was the most common event (8/22). Amplifications in this series included MYCL, MYCN and MYC previously implicated in medulloblastoma pathogenesis, as well as novel amplicons on chromosomes 2, 4, 11 and 12. Losses involving chromosomes 1, 2, 8, 10, 11, 16 and 19 and gains of chromosomes 4, 7, 8, 9 and 18 were seen in greater than 20% of tumors in this series. A homozygous deletion in 11p15 defines the minimal region of loss on this chromosome arm. In order to map the minimal regions involved in losses, gains and amplifications, we combined aCGH data from this series with that of two others obtained using the same RPCI BAC arrays. As a result of this combined analysis of 72 samples, we have defined specific regions on chromosomes 1, 8p, 10q, 11p and 16q which are frequently involved in CNAs in medulloblastomas. Using high density oligonucleotide expression arrays, candidate genes were identified within these consistently involved regions in a subset of the tumors.
Figures
Figure 1
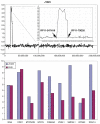
Amplification events seen in the J‐series of medulloblastomas. In tumor J1024 (A) and J1020 (B) well defined (arrows) amplification events are seen on chromosomes 2 (MYCN) and 8 (MYC), respectively. These events are defined by the flanking BACs not involved in the amplicon (insert). Smaller amplicons are seen on 11q in J1008 (C). Much more extensive amplification is seen on 2p involving the MYCN locus (D) in J1008 as well as at two distinct locations on 2q. This more distal amplicon is seen on a background of a single copy loss of distal 2q. More extensive amplification events are seen throughout chromosome 12 in J1008 (E). The single‐BAC amplicon on chromosome 4 (F) in J1002 apparently does not contain annotated genes.
Figure 2
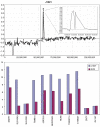
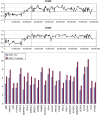
Amplification in 2p23 in tumor J1023. A 4.5 Mbp region shows an approximately 30‐fold increase (Log2 scale) in DNA content in this tumor (top). which demonstrates relatively equal level amplification across the region (inset, top) defined by the end points of the flanking uninvolved BACs. Gene expression analysis from the U133A arrays identifies genes at the proximal end of the amplicon which have increases in expression levels compared with tumors which do not show amplification in this region.
Figure 3
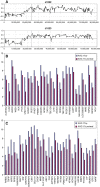
Amplification in the proximal centromeric region (*) of 11q (top) in tumor J1021 shows an amplicon structure (inset, top) which demonstrates an internal region with approximately normal DNA content levels. When the gene expression levels within this region are defined, increases are seen in the proximal region with the exception of SCL43A1 which lies within the region of the amplicon‐containing region showing minimal amplification.
Figure 4
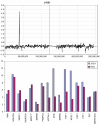
Amplification in 1p34 is seen in tumor J1021 involves only a single bacterial artificial chromosome. Gene expression analysis shows that only the genes within the central part of the amplified region (HPCAL4‐MYCL1) show concordant increases in gene expression levels.
Figure 5
aCGH profile of chromosome 11 from tumor J1021 demonstrating a single copy loss of the entire short arm and homozygous deletion in the 11p15 region (*). Expression analysis of genes in this region shows a significantly reduced level for only four genes (USP47‐MICAL1) located in the center of the deleted region.
Figure 6
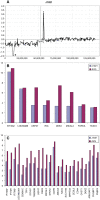
Deletion of the long arm of chromosome 16 is seen in the aCGH profile for tumor J1022. Gene expression analysis of all genes along the length of 16q present on the U133plus2 array shown that only a subset of genes (below) show >twofold reduction in gene expression levels.
Figure 7
A typical aCGH profile for chromosome 17 showing loss of 17p and gain of 17q from tumors J1022 and J1023. When gene expression levels for all of the genes in the commonly deleted region in 17p are compared with tumors which show diploid 17p levels, only the subset of genes shown below have a significantly reduced (> twofold) expression level. * Represents probesets that have _x_ at designation which may cross hybridize in an unpredictable manner.
Figure 8
The genes which show concordant up‐regulation within the common region of 17q gain in tumors J1022 and J1023 are shown relative to expression levels where chromosome 17 appears normal in the aCGH profile. * Represents Affymetrix Probe Set ID with suffix ‘_x_at’ which are known to cross hybridize in an unpredictable manner.
Figure 9
Summary of the losses and gains seen in an extended series of medulloblastomas analyzed by aCGH using the RPCI 6K platform. Each bar, drawn to scale, represents the extent of the losses (shown on the left of the ideograms) and the gains (shown on the right of the ideograms). Whole chromosome changes are included where the width of the bar represents the frequency of the event with the actual number of tumors showing this particular event shown above the bar. High Levels amplifications are described separately in Table 2.
Figure 10
aCGH profiles of chromosome 17 from three medullobastoma tumors, J319 (this study), HMB1 (46) and MD3 (25), exhibiting only regional gains on 17q without losses involving 17p. The minimal region of overlap is defined by tumor MD3.
Similar articles
- Overlay analysis of the oligonucleotide array gene expression profiles and copy number abnormalities as determined by array comparative genomic hybridization in medulloblastomas.
Lo KC, Rossi MR, Burkhardt T, Pomeroy SL, Cowell JK. Lo KC, et al. Genes Chromosomes Cancer. 2007 Jan;46(1):53-66. doi: 10.1002/gcc.20388. Genes Chromosomes Cancer. 2007. PMID: 17044047 - Array CGH analysis of pediatric medulloblastomas.
Rossi MR, Conroy J, McQuaid D, Nowak NJ, Rutka JT, Cowell JK. Rossi MR, et al. Genes Chromosomes Cancer. 2006 Mar;45(3):290-303. doi: 10.1002/gcc.20292. Genes Chromosomes Cancer. 2006. PMID: 16320246 - Detection of oncogene amplifications in medulloblastomas by comparative genomic hybridization and array-based comparative genomic hybridization.
Tong CY, Hui AB, Yin XL, Pang JC, Zhu XL, Poon WS, Ng HK. Tong CY, et al. J Neurosurg. 2004 Feb;100(2 Suppl Pediatrics):187-93. doi: 10.3171/ped.2004.100.2.0187. J Neurosurg. 2004. PMID: 14758948 - Identification of a novel homozygous deletion region at 6q23.1 in medulloblastomas using high-resolution array comparative genomic hybridization analysis.
Hui AB, Takano H, Lo KW, Kuo WL, Lam CN, Tong CY, Chang Q, Gray JW, Ng HK. Hui AB, et al. Clin Cancer Res. 2005 Jul 1;11(13):4707-16. doi: 10.1158/1078-0432.CCR-05-0128. Clin Cancer Res. 2005. PMID: 16000565 - Comparative genomic hybridization of medulloblastomas and clinical relevance: eleven new cases and a review of the literature.
Gilhuis HJ, Anderl KL, Boerman RH, Jeuken JM, James CD, Raffel C, Scheithauer BW, Jenkins RB. Gilhuis HJ, et al. Clin Neurol Neurosurg. 2000 Dec;102(4):203-209. doi: 10.1016/s0303-8467(00)00112-8. Clin Neurol Neurosurg. 2000. PMID: 11154805 Review.
Cited by
- Genetic alterations in microRNAs in medulloblastomas.
Lv SQ, Kim YH, Giulio F, Shalaby T, Nobusawa S, Yang H, Zhou Z, Grotzer M, Ohgaki H. Lv SQ, et al. Brain Pathol. 2012 Mar;22(2):230-9. doi: 10.1111/j.1750-3639.2011.00523.x. Epub 2011 Sep 15. Brain Pathol. 2012. PMID: 21793975 Free PMC article. - Genome-wide molecular characterization of central nervous system primitive neuroectodermal tumor and pineoblastoma.
Miller S, Rogers HA, Lyon P, Rand V, Adamowicz-Brice M, Clifford SC, Hayden JT, Dyer S, Pfister S, Korshunov A, Brundler MA, Lowe J, Coyle B, Grundy RG. Miller S, et al. Neuro Oncol. 2011 Aug;13(8):866-79. doi: 10.1093/neuonc/nor070. Neuro Oncol. 2011. PMID: 21798848 Free PMC article. - Pediatric primary intramedullary spinal cord glioblastoma.
Lober R, Sharma S, Bell B, Free A, Figueroa R, Sheils CW, Lee M, Cowell J. Lober R, et al. Rare Tumors. 2010 Sep 30;2(3):e48. doi: 10.4081/rt.2010.e48. Rare Tumors. 2010. PMID: 21139963 Free PMC article. - Recurrent genomic alterations characterize medulloblastoma arising from DNA double-strand break repair deficiency.
Frappart PO, Lee Y, Russell HR, Chalhoub N, Wang YD, Orii KE, Zhao J, Kondo N, Baker SJ, McKinnon PJ. Frappart PO, et al. Proc Natl Acad Sci U S A. 2009 Feb 10;106(6):1880-5. doi: 10.1073/pnas.0806882106. Epub 2009 Jan 21. Proc Natl Acad Sci U S A. 2009. PMID: 19164512 Free PMC article. - An interferon response gene expression signature is activated in a subset of medulloblastomas.
Staub E. Staub E. Transl Oncol. 2012 Aug;5(4):297-304. doi: 10.1593/tlo.12214. Epub 2012 Aug 1. Transl Oncol. 2012. PMID: 22937182 Free PMC article.
References
- Abarzua F, Sakaguchi M, Takaishi M, Nasu Y, Kurose K, Ebara S, Miyazaki M, Namba M, Kumon H, Huh NH (2005) Adenovirus‐mediated overexpression of REIC/Dkk‐3 selectively induces apoptosis in human prostate cancer cells through activation of c‐Jun‐NH2‐kinase. Cancer Res 65:9617–9622. - PubMed
- Batra SK, McLendon RE, Koo JS, Castelino‐Prabhu S, Fuchs HE, Krischer JP, Friedman HS, Bigner DD, Bigner SH (1995) Prognostic implications of chromosome 17p deletions in human medulloblastomas. J Neurooncol 24:39–45. - PubMed
- Bayani J, Zielenska M, Marrano P, Kwan Ng Y, Taylor MD, Jay V, Rutka JT, Squire JA (2000) Molecular cytogenetic analysis of medulloblastomas and supratentorial primitive neuroectodermal tumors by using conventional banding, comparative genomic hybridization, and spectral karyotyping. J Neurosurg 93:437–448. - PubMed
- Bigner SH, Mark J, Friedman HS, Biegel JA, Bigner DD (1988) Structural chromosomal abnormalities in human medulloblastoma. Cancer Genet Cytogenet 30:91–101. - PubMed
Publication types
MeSH terms
LinkOut - more resources
Full Text Sources
Research Materials

