A hypomorphic R229Q Rag2 mouse mutant recapitulates human Omenn syndrome - PubMed (original) (raw)
. 2007 May;117(5):1260-9.
doi: 10.1172/JCI30928.
Pietro Luigi Poliani, Anna Casati, Francesca Rucci, Laura Frascoli, Marie-Lise Gougeon, Brigitte Lemercier, Marita Bosticardo, Maria Ravanini, Manuela Battaglia, Maria Grazia Roncarolo, Marina Cavazzana-Calvo, Fabio Facchetti, Luigi D Notarangelo, Paolo Vezzoni, Fabio Grassi, Anna Villa
Affiliations
- PMID: 17476358
- PMCID: PMC1857243
- DOI: 10.1172/JCI30928
A hypomorphic R229Q Rag2 mouse mutant recapitulates human Omenn syndrome
Veronica Marrella et al. J Clin Invest. 2007 May.
Abstract
Rag enzymes are the main players in V(D)J recombination, the process responsible for rearrangement of TCR and Ig genes. Hypomorphic Rag mutations in humans, which maintain partial V(D)J activity, cause a peculiar SCID associated with autoimmune-like manifestations, Omenn syndrome (OS). Although a deficient ability to sustain thymopoiesis and to produce a diverse T and B cell repertoire explains the increased susceptibility to severe infections, the molecular and cellular mechanisms underlying the spectrum of clinical and immunological features of OS remain poorly defined. In order to better define the molecular and cellular pathophysiology of OS, we generated a knockin murine model carrying the Rag2 R229Q mutation previously described in several patients with OS and leaky forms of SCID. These Rag2(R229Q/R229Q) mice showed oligoclonal T cells, absence of circulating B cells, and peripheral eosinophilia. In addition, activated T cells infiltrated gut and skin, causing diarrhea, alopecia, and, in some cases, severe erythrodermia. These findings were associated with reduced thymic expression of Aire and markedly reduced numbers of naturally occurring Tregs and NKT lymphocytes. In conclusion, Rag2(R229Q/R229Q) mice mimicked most symptoms of human OS; our findings support the notion that impaired immune tolerance and defective immune regulation are involved in the pathophysiology of OS.
Figures
Figure 1. Generation of _Rag2_R229Q/R229Q ES cells and mice.
(A) A targeting vector was designed to replace endogenous Rag2 with the gene carrying the R229Q substitution and an NheI restriction site. GFP was fused in frame with the Rag2 neo cassette flanked by loxP sites (arrows), which was cloned downstream of the Rag2 UTR (black box). Gray boxes denote the 3′ probe used for genomic screening. (B) Southern blot analysis using the 3′ probe on EcoRV-digested genomic DNAs. Lane 1, 129Sv wild-type ES cells; lane 2, Rag2+/R229Q_neo_Δ
recombinant ES cells; lane 3, heterozygous Rag2+/R229Q_neo_Δ mouse after neo excision due to Cre cross; lane 4, 129Sv Rag2+/+ mouse; lane 5, Rag2+/R229Q_neo_Δ mouse. (C) Chromatogram showing nucleotide substitutions, denoted by underline: the first 2 changes obtained the NheI restriction site, the last 2 caused the R to Q amino acid change (bold).
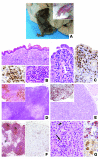
Figure 2. Histological analysis of _Rag2_R229Q/R229Q mice.
(A) Phenotypic aspect of a 3-month-old _Rag2_R229Q/R229Q mouse, showing severe alopecia and skin erythrodermia. (B) Skin biopsy revealed marked dermal inflammation (top) composed of CD3+ lymphocytes (bottom left) and containing numerous eosinophils (bottom right). Original magnification, ×10 (top); ×20 (bottom). (C) Similarly, the gut showed dense inflammatory infiltration (left), mainly composed of CD3+ cells (right). Original magnification, ×20. (D and E) Comparison between thymic tissue from age-matched 6-week-old Rag2+/+ and _Rag2_R229Q/R229Q mice: the normal corticomedullary differentiation observed in Rag2+/+ thymus (D), as highlighted by the anti–cytokeratin 5 immunostaining (D, inset), was absent in the _Rag2_R229Q/R229Q mouse (E and inset). Original magnification, ×4 (D and E). (F) B220 immunostaining showed B follicles (b) and paracortical areas (p) in Rag2+/+ mice (left) in contrast to the abnormal architecture and severe depletion of B cells observed in _Rag2_R229Q/R229Q mice (right). Original magnification, ×4. (G) Nodal parenchyma from the _Rag2_R229Q/R229Q (left) shows admixture of histiocytes, large activated lymphoid cells (arrow), and eosinophils (arrowhead); most lymphoid cells were CD3+ lymphocytes (top right) that expressed the activation antigen CD30 (bottom right). Original magnification, ×20 (left); ×40 (right).
Figure 3. Impaired T cell development and aberrant peripheral T cell activation in _Rag2_R229Q/R229Q mice.
(A) Top left: Fluorescence-activated cell sorting analysis of thymocytes from the indicated mice stained with CD4 and CD8 antibodies. Top right: CD4–CD8– cells were gated and analyzed for CD44 and CD25 expression. Bottom left: TCR-β and CD69 expression in electronically gated CD4+8+ cells. The percentage of TCR-βbrightCD69+ cells is indicated. Bottom right: Overlay of TCR-β surface expression in the indicated thymocyte subsets (gray histograms, Rag2+/+; open histograms, _Rag2_R229Q/R229Q). (B) Left: Percentage of cells during different T cell differentiation stages in the thymus. Right: Percentage of differentiating DN cells. Results are the mean and SD of 5 _Rag_2+/+ and 10 _Rag2_R229Q/R229Q mice. P values were determined by unpaired Student’s t test.
Figure 4. Peripheral T cells and T cell proliferation.
(A) Top: Fluorescence-activated cell sorting analysis of lymph node cells stained with CD4 and CD8 antibodies. Bottom: CD4+ and CD8+ cells from the indicated mice were analyzed for CD44 and CD62L distribution. (B) Proliferation of Rag2+/+ and _Rag2_R229Q/R229Q CD90+ cells isolated from splenocytes, plated at 2 × 10⁵ cells per well, and stimulated as indicated. Proliferation was assessed by 3H-thymidine incorporation in triplicate wells. Plotted values are cpm for each individual mouse. Bars represent the median for each group.
Figure 5. Immunoscope analysis of TCR repertoire.
(A) Quantitative TCRVβ repertoire determined by real-time PCR analysis on T cells from the 2 thymi and 4 spleens from _Rag2_R229Q/R229Q mice (designated as 1–4) and from 2 representative Rag2+/+ mice (designated as 1 and 2). (B) Representative immunoscope profiles of TCRVβ analysis in the thymi and spleens of the mice as in A. The x axes represent CDR3 length, and y axes represent arbitrary fluorescence intensity of the runoff products.
Figure 6. Impaired B cell development in _Rag2_R229Q/R229Q mice.
(A) Top: Relative representation and SD of B220low and B220high cells in the bone marrow of the indicated mice (n = 6). Bottom: Dot-plot analysis of bone marrow cells from the indicated mice labeled with B220 and CD2 antibodies and IgD and IgM expression of electronically gated B220+ bone marrow cells. (B) Top: Relative representation and SD of B220+ cells in the spleens of the indicated mice (n = 6). Bottom: Dot-plot analysis of B220+ splenocytes labeled with CD21 and CD23 antibodies or IgD and IgM antibodies. P values were determined by unpaired Student’s t test. Numbers indicate the percentage of cells in the indicated gates.
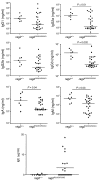
Figure 7. Serum concentration of Igs.
Sera from Rag2+/+ and _Rag2_R229Q/R229Q mice were collected and their IgG1, IgG2, IgG3, IgA, and IgM were evaluated by Bioplex analysis, while ELISA assay was performed to measure IgE production. Bars represent the median for each group. P values were determined by Mann-Whitney test.
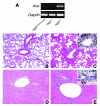
Figure 8. AIRE expression analysis and cellular infiltration in target organs.
(A) Amplification of Aire cDNAs obtained from Rag2+/+, Rag2 R229Q/R229Q, and _Rag2_–/– thymic mRNAs. As an internal control, Gapdh was used. (B–E) Inflammatory infiltration in the lungs and livers of Rag2+/+ and _Rag2_R229Q/R229Q mice. Compared with the Rag2+/+ mouse (B), histological analysis of a representative 4-month-old _Rag2_R229Q/R229Q mouse revealed dense peribronchiolar and perivascular inflammatory infiltration in the lung (C) composed mainly of CD3+ lymphocytes (C, inset). Similarly, in contrast to the control mouse (D), dense inflammatory infiltration composed of CD3+ T cells was found in liver portal tracts (E and inset). Original magnification, ×10 (B–E); ×40 (insets).
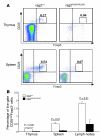
Figure 9. Analysis of nTregs in _Rag2_R229Q/R229Q mice.
(A) Fluorescence-activated cell sorting analysis of thymus and spleen cells stained with CD25 and Foxp3 antibodies electronically gated on CD4+ cells. Numbers indicate the percentages of total live cells. (B) Histograms show percentage of CD25highFoxp3+ cells in thymi, spleens, and lymph nodes of Rag2+/+ and _Rag2_R229Q/R229Q mice. P values were determined by unpaired Student’s t test.
Comment in
- Murine models of Omenn syndrome.
Wong SY, Roth DB. Wong SY, et al. J Clin Invest. 2007 May;117(5):1213-6. doi: 10.1172/JCI32214. J Clin Invest. 2007. PMID: 17476351 Free PMC article. Review.
Similar articles
- The R229Q mutation of Rag2 does not characterize severe immunodeficiency in mice.
Jin Y, Lee A, Oh JH, Lee HW, Ha SJ. Jin Y, et al. Sci Rep. 2019 Mar 14;9(1):4415. doi: 10.1038/s41598-019-39496-5. Sci Rep. 2019. PMID: 30872621 Free PMC article. - Cutaneous barrier leakage and gut inflammation drive skin disease in Omenn syndrome.
Rigoni R, Fontana E, Dobbs K, Marrella V, Taverniti V, Maina V, Facoetti A, D'Amico G, Al-Herz W, Cruz-Munoz ME, Schuetz C, Gennery AR, Garabedian EK, Giliani S, Draper D, Dbaibo G, Geha RS, Meyts I, Tousseyn T, Neven B, Moshous D, Fischer A, Schulz A, Finocchi A, Kuhns DB, Fink DL, Lionakis MS, Swamydas M, Guglielmetti S, Alejo J, Myles IA, Pittaluga S, Notarangelo LD, Villa A, Cassani B. Rigoni R, et al. J Allergy Clin Immunol. 2020 Nov;146(5):1165-1179.e11. doi: 10.1016/j.jaci.2020.04.005. Epub 2020 Apr 18. J Allergy Clin Immunol. 2020. PMID: 32311393 Free PMC article. - Hypomorphic mutation in the RAG2 gene affects dendritic cell distribution and migration.
Maina V, Marrella V, Mantero S, Cassani B, Fontana E, Anselmo A, Del Prete A, Sozzani S, Vezzoni P, Poliani PL, Villa A. Maina V, et al. J Leukoc Biol. 2013 Dec;94(6):1221-30. doi: 10.1189/jlb.0713365. Epub 2013 Sep 19. J Leukoc Biol. 2013. PMID: 24052573 - Omenn syndrome--review of several phenotypes of Omenn syndrome and RAG1/RAG2 mutations in Japan.
Kato M, Kimura H, Seki M, Shimada A, Hayashi Y, Morio T, Kumaki S, Ishida Y, Kamachi Y, Yachie A. Kato M, et al. Allergol Int. 2006 Jun;55(2):115-9. doi: 10.2332/allergolint.55.115. Allergol Int. 2006. PMID: 17075247 Review. - Of Omenn and mice.
Marrella V, Poliani PL, Sobacchi C, Grassi F, Villa A. Marrella V, et al. Trends Immunol. 2008 Mar;29(3):133-40. doi: 10.1016/j.it.2007.12.001. Epub 2008 Feb 5. Trends Immunol. 2008. PMID: 18255337 Review.
Cited by
- Preclinical Development of Autologous Hematopoietic Stem Cell-Based Gene Therapy for Immune Deficiencies: A Journey from Mouse Cage to Bed Side.
Garcia-Perez L, Ordas A, Canté-Barrett K, Meij P, Pike-Overzet K, Lankester A, Staal FJT. Garcia-Perez L, et al. Pharmaceutics. 2020 Jun 13;12(6):549. doi: 10.3390/pharmaceutics12060549. Pharmaceutics. 2020. PMID: 32545727 Free PMC article. Review. - Anti-CD3ε mAb improves thymic architecture and prevents autoimmune manifestations in a mouse model of Omenn syndrome: therapeutic implications.
Marrella V, Poliani PL, Fontana E, Casati A, Maina V, Cassani B, Ficara F, Cominelli M, Schena F, Paulis M, Traggiai E, Vezzoni P, Grassi F, Villa A. Marrella V, et al. Blood. 2012 Aug 2;120(5):1005-14. doi: 10.1182/blood-2012-01-406827. Epub 2012 Jun 21. Blood. 2012. PMID: 22723555 Free PMC article. - The R229Q mutation of Rag2 does not characterize severe immunodeficiency in mice.
Jin Y, Lee A, Oh JH, Lee HW, Ha SJ. Jin Y, et al. Sci Rep. 2019 Mar 14;9(1):4415. doi: 10.1038/s41598-019-39496-5. Sci Rep. 2019. PMID: 30872621 Free PMC article. - Altered T-cell receptor signaling in the pathogenesis of allergic disease.
Datta S, Milner JD. Datta S, et al. J Allergy Clin Immunol. 2011 Feb;127(2):351-4. doi: 10.1016/j.jaci.2010.11.033. J Allergy Clin Immunol. 2011. PMID: 21281865 Free PMC article. Review. - The thymocyte-specific RNA-binding protein Arpp21 provides TCR repertoire diversity by binding to the 3'-UTR and promoting Rag1 mRNA expression.
Xu M, Ito-Kureha T, Kang HS, Chernev A, Raj T, Hoefig KP, Hohn C, Giesert F, Wang Y, Pan W, Ziętara N, Straub T, Feederle R, Daniel C, Adler B, König J, Feske S, Tsokos GC, Wurst W, Urlaub H, Sattler M, Kisielow J, Wulczyn FG, Łyszkiewicz M, Heissmeyer V. Xu M, et al. Nat Commun. 2024 Mar 11;15(1):2194. doi: 10.1038/s41467-024-46371-z. Nat Commun. 2024. PMID: 38467629 Free PMC article.
References
- Honig M., Schwarz K. Omenn syndrome: a lack of tolerance on the background of deficient lymphocyte development and maturation. Curr. Opin. Rheumatol. 2006;18:383–388. - PubMed
- Notarangelo L.D., Gambineri E., Badolato R. Immunodeficiencies with autoimmune consequences. Adv. Immunol. . 2006;89:321–370. - PubMed
- Omenn G.S. Familial reticuloendotheliosis with eosinophilia. N. Engl. J. Med. 1965;273:427–432. - PubMed
- Santagata S., Villa A., Sobacchi C., Cortes P., Vezzoni P. The genetic and biochemical basis of Omenn syndrome. Immunol. Rev. 2000;178:64–74. - PubMed
- Mazzolari E., et al. Hematopoietic stem cell transplantation in Omenn syndrome: a single-center experience. Bone Marrow Transplant. 2005;36:107–114. - PubMed
Publication types
MeSH terms
Substances
LinkOut - more resources
Full Text Sources
Medical
Molecular Biology Databases


