Caspase-9 regulates apoptosis/proliferation balance during metamorphic brain remodeling in Xenopus - PubMed (original) (raw)
Caspase-9 regulates apoptosis/proliferation balance during metamorphic brain remodeling in Xenopus
Laurent Coen et al. Proc Natl Acad Sci U S A. 2007.
Abstract
During anuran metamorphosis, the tadpole brain is transformed producing the sensorial and motor systems required for the frog's predatory lifestyle. Nervous system remodeling simultaneously implicates apoptosis, cell division, and differentiation. The molecular mechanisms underlying this remodeling have yet to be characterized. Starting from the observation that active caspase-9 and the Bcl-X(L) homologue, XR11 are highly expressed in tadpole brain during metamorphosis, we determined their implication in regulating the balance of apoptosis and proliferation in the developing tadpole brain. In situ hybridization showed caspase-9 mRNA to be expressed mainly in the ventricular area, a site of neuroblast proliferation. To test the functional role of caspase-9 in equilibrating neuroblast production and elimination, we overexpressed a dominant-negative caspase-9 protein, DN9, in the tadpole brain using somatic gene transfer and germinal transgenesis. In both cases, abrogating caspase-9 activity significantly decreased brain apoptosis and increased numbers of actively proliferating cells in the ventricular zone. Moreover, overexpression of XR11 with or without DN9 was also effective in decreasing apoptosis and increasing cell division in the tadpole brain. We conclude that XR11 and caspase-9, two key members of the mitochondrial death pathway, are implicated in controlling the proliferative status of neuroblasts in the metamorphosing Xenopus brain. Modification of their expression during the critical period of metamorphosis alters the outcome of metamorphic neurogenesis, resulting in a modified brain phenotype in juvenile Xenopus.
Conflict of interest statement
The authors declare no conflict of interest.
Figures
Fig. 1.
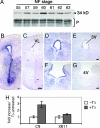
Caspase-9 mRNA and activated caspase-9 increase in metamorphic tadpole brains. (A) Activation of C9 was monitored by Western blotting on brain extracts of tadpoles at different stages of metamorphosis, by using an active C9 specific antibody. The 34-kDa band, corresponding to conversion of pro-C9 to active C9, as predicted from cleavage sites in the procaspase sequences (17), is seen from stage NF55 (onset of metamorphosis) up to stage NF63 (end of metamorphosis), peaking at stage NF60 (climax of metamorphosis). The immunoblot was repeated by using independent samples. Equal amounts of proteins were loaded per lane and subsequently confirmed by Ponceau-S staining (P). (B–G) Spatial distribution of C9 mRNA in Xenopus brains at stage NF63 with ISH, by using an antisense digoxigenin-labeled probe on coronal sections (B, D, and F). Strong localized expression of C9 mRNA is seen in the ventricular zone of the anterior (B), medial (D), and posterior (F) brain. Control adjacent sections were hybridized with a sense probe (C, E, and G), showing no labeling. ISH was done twice on independent groups of tadpoles showing identical results. VL, 3V, and 4V: lateral, third, and fourth ventricles. (Scale bars: B–G, 50 μm.) (H) Quantitative-PCR analysis of C9 and XR11 expression after T3-treatment of perchlorated tadpoles. Fold inductions were normalized against untreated tadpoles. Statistical analysis for PCR data were done comparing the means of ΔCT values ± SD, by using Student's t test (n ≥ 3): Differences were extremely significant for C9 (P < 0.001) and significant for XR11 (P < 0.05).
Fig. 2.
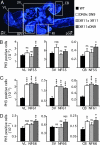
Cell proliferation increases at metamorphic climax in brains of transgenics overexpressing DN9 and/or XR11. Cell proliferation was followed in Nβt-driven DN9-RFP (DN9xDN9), XR11-GFP (XR11xXR11), and double-transgenic XR11-GFP/DN9-RFP (XR11xDN9) tadpoles by using a PH3-antibody and compared with WT or Nβt-driven RFP and GFP transgenic controls at different stages of metamorphosis. (A) DAPI- labeled sagittal section of a brain showing the three areas analyzed: VL, 3V, and CB. Proliferating cells were counted in the cell layers bordering ventricles for each area. (B) PH3-positive cells were counted at stage NF55 (onset of metamorphosis), around the VL in the anterior brain (VL NF55), the 3V (3V NF55), and the CB (CB NF55). Note that mitosis was enhanced only in VL and CB for XR11xDN9, but overall proliferation at this stage did not differ between transgenics and WT. (C) PH3-positive cells were counted at stage NF61 (climax of metamorphosis), in the same areas as for stage NF55. Note that mitosis was strongly enhanced in all areas for all transgenics compared with WT. (D) PH3-positive cells were counted at stage NF66 (end of metamorphosis), in the same areas as B and C. Note that mitotic numbers only show a slight, but significant, increase in VL for XR11xDN9 and in CB for DN9xDN9 and XR11xDN9. Means ± SEM are given; n > 6 in each group; not significant (ns), P < 0.5; not quite significant (nqs), P < 0.1; ∗, P < 0.05; ∗∗, P < 0.01; ∗∗∗, P < 0.001. RPr, recessus preopticus; RI, recessus infundibuli; OT, optic tectum.
Fig. 3.
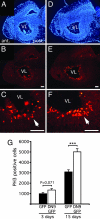
DN9 expression increases active cell proliferation in the ventricular zone of transfected brain. SGT in brain was carried out at stage NF57 by using CMV-driven DN9-GFP or GFP constructs, and proliferation was compared between DN9 and controls at 3 and 15 days after transfection by using the PH3-antibody. (A–F) Mitotic cells were observed on _para_-sagittal sections at 15 days after transfection for control (B and magnification, C) and compared with DN9 (E and magnification, F), showing more proliferative cells in DN9-transfected brain. DAPI counterstaining shows the same anterior brain region compared with control (A) and DN9 transfections (D). Note at higher magnification the greater concentration of positive cells for DN9 (arrows) lining the ventricle. (G) PH3-positive cells were counted for the VL in the anterior brain, showing a strong increase in mitosis in brains transfected with DN9 vs. controls. Each experiment was repeated twice, giving similar results. Means ± SEM are given; n > 6 in each group; ∗∗∗, P < 0.001. (Scale bars: A-F, 100 μm.)
Fig. 4.
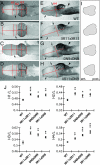
Overexpression of DN9 and/or XR11 during metamorphosis modifies brain morphology in transgenic animals. (A–H) Representative brains seen in dorsal (A–D) or lateral (E–H) views are shown for WT (A and E), XR11xXR11 (B and F), DN9xDN9 (C and G), and XR11xDN9 (D and H) tadpoles. Note that commissures at the junctions between olfactory bulb or medial brain with the anterior brain (compare arrows) are more marked in control than in transgenics. Note also the larger CB in transgenics vs. WT (compare arrowheads). (I) Schematic representation of the forebrain of WT and each transgenic seen in E, F, G, and H, respectively (lateral views). The form of the forebrain shows a progressive compaction, XR11xXR11 and DN9xDN9 corresponding to an intermediate state and XR11xDN9 to the most marked compaction. (J) Different measurements were done for transgenic and WT brains, width of the forebrain (H1), width of the midbrain (H2 and H4), and width of the optic tectum (H3), and ratios were calculated with respect to brain length from the rostral tip to rear of optic tectum (L). All ratios H/L given for each measure were significantly increased in all transgenics in comparison with WT. Means ± SEM are given; n > 6 in each group; ∗, P < 0.05; ∗∗, P < 0.01; ∗∗∗, P < 0.001.
Similar articles
- Xenopus Bcl-X(L) selectively protects Rohon-Beard neurons from metamorphic degeneration.
Coen L, du Pasquier D, Le Mevel S, Brown S, Tata J, Mazabraud A, Demeneix BA. Coen L, et al. Proc Natl Acad Sci U S A. 2001 Jul 3;98(14):7869-74. doi: 10.1073/pnas.141226798. Epub 2001 Jun 26. Proc Natl Acad Sci U S A. 2001. PMID: 11427732 Free PMC article. - The roles of Bcl-xL in modulating apoptosis during development of Xenopus laevis.
Johnston J, Chan R, Calderon-Segura M, McFarlane S, Browder LW. Johnston J, et al. BMC Dev Biol. 2005 Sep 26;5:20. doi: 10.1186/1471-213X-5-20. BMC Dev Biol. 2005. PMID: 16185362 Free PMC article. - Apoptosis of tail muscle during amphibian metamorphosis involves a caspase 9-dependent mechanism.
Rowe I, Le Blay K, Du Pasquier D, Palmier K, Levi G, Demeneix B, Coen L. Rowe I, et al. Dev Dyn. 2005 May;233(1):76-87. doi: 10.1002/dvdy.20312. Dev Dyn. 2005. PMID: 15765509 - Molecular and cellular basis of tissue remodeling during amphibian metamorphosis.
Su Y, Damjanovski S, Shi Y, Shi YB. Su Y, et al. Histol Histopathol. 1999 Jan;14(1):175-83. doi: 10.14670/HH-14.175. Histol Histopathol. 1999. PMID: 9987663 Review. - Apoptosis of larval cells during amphibian metamorphosis.
Ishizuya-Oka A. Ishizuya-Oka A. Microsc Res Tech. 1996 Jun 15;34(3):228-35. doi: 10.1002/(SICI)1097-0029(19960615)34:3<228::AID-JEMT5>3.0.CO;2-L. Microsc Res Tech. 1996. PMID: 8743410 Review.
Cited by
- Shaping organisms with apoptosis.
Suzanne M, Steller H. Suzanne M, et al. Cell Death Differ. 2013 May;20(5):669-75. doi: 10.1038/cdd.2013.11. Epub 2013 Mar 1. Cell Death Differ. 2013. PMID: 23449394 Free PMC article. Review. - The timecourse of apoptotic cell death during postnatal remodeling of the mouse cochlea and its premature onset by triiodothyronine (T3).
Peeters RP, Ng L, Ma M, Forrest D. Peeters RP, et al. Mol Cell Endocrinol. 2015 May 15;407:1-8. doi: 10.1016/j.mce.2015.02.025. Epub 2015 Feb 28. Mol Cell Endocrinol. 2015. PMID: 25737207 Free PMC article. - Anti-apoptotic activity and proteasome-mediated degradation of Xenopus Mcl-1 protein in egg extracts.
Tsuchiya Y, Yamashita S. Tsuchiya Y, et al. J Biol Chem. 2011 May 6;286(18):15806-14. doi: 10.1074/jbc.M110.175927. Epub 2011 Mar 17. J Biol Chem. 2011. PMID: 21454490 Free PMC article. - Identification of thyroid hormone response genes in the remodeling of dorsal muscle during Microhyla fissipes metamorphosis.
Liu L, Liu Q, Zou X, Chen Q, Wang X, Gao Z, Jiang J. Liu L, et al. Front Endocrinol (Lausanne). 2023 Feb 3;14:1099130. doi: 10.3389/fendo.2023.1099130. eCollection 2023. Front Endocrinol (Lausanne). 2023. PMID: 36817577 Free PMC article. - Identification and differential regulation of microRNAs during thyroid hormone-dependent metamorphosis in Microhyla fissipes.
Liu L, Zhu W, Liu J, Wang S, Jiang J. Liu L, et al. BMC Genomics. 2018 Jun 28;19(1):507. doi: 10.1186/s12864-018-4848-x. BMC Genomics. 2018. PMID: 29954327 Free PMC article.
References
- Dodd MHI, Dodd JM. In: The Biology of Metamorphosis, Physiology of the Amphibia. Lofts B, editor. San Francisco: Academic; 1976.
- Danial NN, Korsmeyer SJ. Cell. 2004;116:205–219. - PubMed
- Gorman AM, Ceccatelli S, Orrenius S. Dev Neurosci. 2000;22:348–358. - PubMed
- Nijhawan D, Honarpour N, Wang X. Annu Rev Neurosci. 2000;23:73–87. - PubMed
- Mattson MP. Nat Rev Mol Cell Biol. 2000;1:120–129. - PubMed
Publication types
MeSH terms
Substances
LinkOut - more resources
Full Text Sources
Research Materials


