Theoretical analysis of an iron mineral-based magnetoreceptor model in birds - PubMed (original) (raw)
Theoretical analysis of an iron mineral-based magnetoreceptor model in birds
Ilia A Solov'yov et al. Biophys J. 2007.
Abstract
Sensing the magnetic field has been established as an essential part of navigation and orientation of various animals for many years. Only recently has the first detailed receptor concept for magnetoreception been published based on histological and physical results. The considered mechanism involves two types of iron minerals (magnetite and maghemite) that were found in subcellular compartments within sensory dendrites of the upper beak of several bird species. But so far a quantitative evaluation of the proposed receptor is missing. In this article, we develop a theoretical model to quantitatively and qualitatively describe the magnetic field effects among particles containing iron minerals. The analysis of forces acting between these subcellular compartments shows a particular dependence on the orientation of the external magnetic field. The iron minerals in the beak are found in the form of crystalline maghemite platelets and assemblies of magnetite nanoparticles. We demonstrate that the pull or push to the magnetite assemblies, which are connected to the cell membrane, may reach a value of 0.2 pN -- sufficient to excite specific mechanoreceptive membrane channels in the nerve cell. The theoretical analysis of the assumed magnetoreceptor system in the avian beak skin clearly shows that it might indeed be a sensitive biological magnetometer providing an essential part of the magnetic map for navigation.
Figures
FIGURE 1
Experimental findings of Fleissner et al. (31) showing the characterization and subcellular localization of iron minerals within a dendrite. The drawing shows schematically the structure of a single dendrite as derived from serial ultrathin sections with the three subcellular components containing iron: chains of maghemite crystals (1 × 0.1 × 1 _μ_m) magnetite clusters (diameter ∼1 _μ_m), and the iron-coated vesicle (diameter 3–5 _μ_m). Figure presented by the courtesy of Gerta and Günther Fleissner, Universität Frankfurt am Main.
FIGURE 2
Smallest magnetoreceptor unit consisting of 10 maghemite platelets (boxes) and a magnetite cluster (sphere). The coordinate frame shown in the figure is used in the computations throughout the article. The direction of the external magnetic induction vector is characterized by the polar angle Θ and the azimuthal angle Φ as shown. The magnetic moments of the _i_th maghemite platelet and of the magnetite cluster are shown with
and
respectively.
FIGURE 3
Hysteresis profile of a ferrimagnet. The remanent magnetization M, saturation magnetization _M_sat, and coercive force _B_cf are indicated. The typical parameters of the hysteresis plot for maghemite are M = 50 emu/cm3 (47), _M_sat = 377 emu/cm3 (48), and _B_cf = 233 G (48). For magnetite, _M_sat = 480 emu/cm3 (47) and _B_cf = 180–300 G (48).
FIGURE 4
Illustration of the integration scheme used in the model of interacting dipoles of finite size. Coordinate frames used for the integration over the volume of the magnetite cluster (_x_1, _y_1, _z_1) and over the maghemite platelets (_x_2, _y_2, _z_2) are indicated. The splitting of the platelets and of the cluster into infinitesimal parts is schematically shown. The infinitesimal part inside the cluster is characterized by the vector while the infinitesimal part inside a platelet is characterized by the vector
The vector
connects the center of the _j_th platelet with the center of the cluster.
FIGURE 5
Potential energy surfaces of the magnetite cluster calculated in the case when the maghemite platelets and the magnetite cluster are assumed pointlike dipoles. The potential energy surfaces are shown as a function of its x and y coordinates, while z = 0 _μ_m (see Fig. 2) calculated at different orientations of the external magnetic field vector: magnetic field vector aligned along the x axis (a); magnetic field vector aligned along the y axis (b); and magnetic field vector aligned along the z axis (c). The maghemite platelets are shown with solid rectangles. The shaded rectangle in the center of the potential energy surfaces shows the region where the magnetite cluster can not be placed due to the finite size of the particles in the system. The energy scale is given in eV to the right of the contour plots. The equipotential lines are shown for the energies −0.03, −0.06, −0.12, −0.24, −0.48, and −0.96 eV. The region of the potential energy surface near the maghemite platelets chain tip is shown to the left of the corresponding surface with greater resolution. The equipotential lines in these contour plots are shown for the energies −1, −2, −3, −4, −5, −6, −7, −8, and −9 eV.
FIGURE 6
The difference between the potential energy of the magnetite cluster calculated in the first and in the fourth orders of approximation using Eq. 23. The energy scale is given in meV. The equipotential lines are shown for the energies −0.2, −0.5, −1.0, −1.5, −2.0, −2.5, and −3.0 meV. The external magnetic field is directed along the z axis.
FIGURE 7
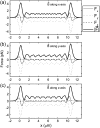
Force components acting on the magnetite cluster as a function of the x coordinate of the magnetite cluster, while the y and z coordinates are 0.8 _μ_m and 0 _μ_m, respectively (see Fig. 2), calculated at different orientations of the external magnetic field vector: plots a–c correspond to the alignment of the magnetic field vector along the x, y, and z axes, respectively. The x, y, and z components of the force vector are shown with thin-solid, dotted, and dashed lines, respectively. Thick lines show the dependence of the force vector magnitude on the x coordinate of the magnetite cluster.
FIGURE 8
Difference in force components acting on the magnetite cluster at different orientations of the external magnetic field vector. The plots in the left part of the figure show the difference between the force components corresponding to the change of external magnetic field orientation from x to z, while plots in the right part of the figure show the differences between the force components corresponding to the change from x to y orientation are shown. Plots a_–_c show the differences arising in the x, y, and z components of the force vector as a function of the x coordinate of the magnetite cluster. The x dependence of the magnitude of the force difference vector is shown in plot d of the figure. The y and z coordinates of the magnetite cluster are 0.8 _μ_m and 0 _μ_m, respectively.
FIGURE 9
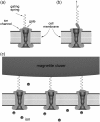
Schematic illustration of the gating-spring transducer mechanism of the geomagnetic field. The opening/closing of the mechanosensitive ion channel is regulated by the gate, which is connected to an elastic element, the gating spring. The channel has two conformations, closed (a) and open (b), being in thermal equilibrium. The gating springs are connected to the magnetite cluster (c), which produces an external pull on the gates.
FIGURE 10
Change of the mechanosensitive ion channel opening probability calculated as the function of the intrinsic energy between the open and the closed states of the channel. Thick line corresponds to the gating-spring transducer mechanism and thin line corresponds to the mechanism based on the elastic deformation of the membrane (thin line). The change of channel opening probability for the gating-spring transducer mechanism and for the mechanism based on the elastic deformation of the membrane were calculated using Eqs. 40 and 50, respectively.
FIGURE 11
Schematic illustration of the transducer mechanism of the geomagnetic field based on the elastic deformation of the membrane. The external magnetic field causes the change in the pressure that the magnetite cluster puts on the cell membrane, causing its deformation. The nondeformed membrane corresponding to the case of low magnetic field is shown in part a of the figure. The increase of the magnetic field creates a stress situation leading to the membrane deformation caused by either pull (b) or push (c) of the magnetite cluster on the membrane. The magnetite cluster is shown schematically atop the membrane. The connections of the magnetite cluster with the membrane is shown with the springs. Note that the ion channel, the membrane, and the magnetite cluster are drawn approximately in the correct scale, while the ions are shown schematically.
FIGURE 12
Schematic illustration of the membrane deformation caused by the external magnetic field. The values Δ_x_ and Δ_y_ are the deformation increments describing the membrane deformation, _R_0 is the radius of the deformation, and _S_0 and _S_1 are the areas of the membrane deformation region corresponding to the nondeformed and stress cases, respectively.
FIGURE 13
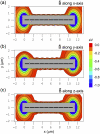
Potential energy surfaces of the magnetite cluster calculated in the case when the integration over the volume of the maghemite platelets and of the magnetite cluster is performed. The potential energy of the magnetite cluster is plotted as a function of x and y coordinates of the magnetite cluster, while z = 0 _μ_m (see Fig. 2). The energy is calculated at different orientations of the external magnetic field vector. Plots a_–_c correspond to the alignment of the external magnetic field along the x, y, and z axes, respectively. The maghemite platelets are shown with solid rectangles. The shaded rectangle in the center of the potential energy surfaces shows the region where the magnetite cluster cannot be placed due to its finite size. The energy scale is given in eV. The equipotential lines are shown for the energies −0.03, −0.06, −0.12, −0.24, −0.48, and −0.96 eV.
FIGURE 14
Difference in forces acting on the magnetite cluster at different orientations of the external magnetic field vector calculated in the case when the integration over the volume of the maghemite platelets and of the magnetite cluster is performed. Plots in the left part of the figure show the difference between the force components arising due to the x → z change of the direction of the external magnetic field vector, while plots in the right part of the figure show the differences between force components arising due to the x → y change. Plots a_–_c show the differences arising in the x, y, and z components of the force vector as a function of the x coordinate of the magnetite cluster. The x dependence of the magnitude of the force difference vector is shown in plot d of the figure. The y and z coordinates of the magnetite cluster are 0.8 _μ_m and 0 _μ_m, respectively.
Similar articles
- A novel concept of Fe-mineral-based magnetoreception: histological and physicochemical data from the upper beak of homing pigeons.
Fleissner G, Stahl B, Thalau P, Falkenberg G, Fleissner G. Fleissner G, et al. Naturwissenschaften. 2007 Aug;94(8):631-42. doi: 10.1007/s00114-007-0236-0. Epub 2007 Mar 15. Naturwissenschaften. 2007. PMID: 17361399 - Avian magnetoreception: elaborate iron mineral containing dendrites in the upper beak seem to be a common feature of birds.
Falkenberg G, Fleissner G, Schuchardt K, Kuehbacher M, Thalau P, Mouritsen H, Heyers D, Wellenreuther G, Fleissner G. Falkenberg G, et al. PLoS One. 2010 Feb 16;5(2):e9231. doi: 10.1371/journal.pone.0009231. PLoS One. 2010. PMID: 20169083 Free PMC article. - Theoretical analysis of flux amplification by soft magnetic material in a putative biological magnetic-field receptor.
Shcherbakov VP, Winklhofer M. Shcherbakov VP, et al. Phys Rev E Stat Nonlin Soft Matter Phys. 2010 Mar;81(3 Pt 1):031921. doi: 10.1103/PhysRevE.81.031921. Epub 2010 Mar 26. Phys Rev E Stat Nonlin Soft Matter Phys. 2010. PMID: 20365784 - Magnetoreception and its use in bird navigation.
Mouritsen H, Ritz T. Mouritsen H, et al. Curr Opin Neurobiol. 2005 Aug;15(4):406-14. doi: 10.1016/j.conb.2005.06.003. Curr Opin Neurobiol. 2005. PMID: 16006116 Review. - [Magnetoreception systems in birds: a review of current research].
Kishkinev DA, Chernetsov NS. Kishkinev DA, et al. Zh Obshch Biol. 2014 Mar-Apr;75(2):104-23. Zh Obshch Biol. 2014. PMID: 25490840 Review. Russian.
Cited by
- Hypothetical superparamagnetic magnetometer in a pigeon's upper beak probably does not work.
Jandačka P, Alexa P, Pištora J, Trojková J. Jandačka P, et al. Eur Phys J E Soft Matter. 2013 Apr;36(4):9853. doi: 10.1140/epje/i2013-13040-1. Epub 2013 Apr 23. Eur Phys J E Soft Matter. 2013. PMID: 23605568 - A quantitative assessment of torque-transducer models for magnetoreception.
Winklhofer M, Kirschvink JL. Winklhofer M, et al. J R Soc Interface. 2010 Apr 6;7 Suppl 2(Suppl 2):S273-89. doi: 10.1098/rsif.2009.0435.focus. Epub 2010 Jan 19. J R Soc Interface. 2010. PMID: 20086054 Free PMC article. - Activation of Cryptochrome 4 from Atlantic Herring.
Frederiksen A, Aldag M, Solov'yov IA, Gerhards L. Frederiksen A, et al. Biology (Basel). 2024 Apr 15;13(4):262. doi: 10.3390/biology13040262. Biology (Basel). 2024. PMID: 38666874 Free PMC article. - Magnetoreception in birds: no intensity window in "fixed direction" responses.
Wiltschko W, Dehe L, Stapput K, Thalau P, Wiltschko R. Wiltschko W, et al. Naturwissenschaften. 2010 Jan;97(1):37-42. doi: 10.1007/s00114-009-0608-8. Epub 2009 Sep 17. Naturwissenschaften. 2010. PMID: 19760275 - Chemical magnetoreception in birds: the radical pair mechanism.
Rodgers CT, Hore PJ. Rodgers CT, et al. Proc Natl Acad Sci U S A. 2009 Jan 13;106(2):353-60. doi: 10.1073/pnas.0711968106. Epub 2009 Jan 7. Proc Natl Acad Sci U S A. 2009. PMID: 19129499 Free PMC article.
References
- von Middendorff, A. 1859. Lines on maps showing bird migration in Russia. Mem. Acad. Sci. St. Petersbourg VI Ser. 8:1–43.
- Viguier, C. 1882. The sense of orientation and its organs in animals and in man. Revue Philosophique de la France et de l'Etranger. 14:1–36.
- Wiltschko, W., and F. Merkel. 1966. Orientation of migratory-excited European robins in static magnetic field. Verh. dt. Zool. Ges. 59:362–367.
- Wiltschko, W., and R. Wiltschko. 2005. Magnetic orientation and magnetoreception in birds and other animals. J. Comp. Physiol. [A]. 191:675–693. - PubMed
- Lohmann, K., S. Cain, S. Dodge, and C. Lohmann. 2001. Regional magnetic fields as navigational markers for sea turtles. Science. 294:364–366. - PubMed
Publication types
MeSH terms
Substances
LinkOut - more resources
Full Text Sources
Medical


