Beta-amyloid disrupted synaptic vesicle endocytosis in cultured hippocampal neurons - PubMed (original) (raw)
Beta-amyloid disrupted synaptic vesicle endocytosis in cultured hippocampal neurons
B L Kelly et al. Neuroscience. 2007.
Abstract
Neuronal death leading to gross brain atrophy is commonly seen in Alzheimer's disease (AD) patients. Yet, it is becoming increasingly apparent that the pathogenesis of AD involves early and more discrete synaptic changes in affected brain areas. However, the molecular mechanisms that underlie such synaptic dysfunction remain largely unknown. Recently, we have identified dynamin 1, a protein that plays a critical role in synaptic vesicle endocytosis, and hence, in the signaling properties of the synapse, as a potential molecular determinant of such dysfunction in AD. In the present study, we analyzed beta-amyloid (Abeta)-induced changes in synaptic vesicle recycling in rat cultured hippocampal neurons. Our results showed that Abeta, the main component of senile plaques, caused ultrastructural changes indicative of impaired synaptic vesicle endocytosis in cultured hippocampal neurons that have been stimulated by depolarization with high potassium. In addition, Abeta led to the accumulation of amphiphysin in membrane fractions from stimulated hippocampal neurons. Moreover, experiments using FM1-43 showed reduced dye uptake in stimulated hippocampal neurons treated with Abeta when compared with untreated stimulated controls. Similar results were obtained using a dynamin 1 inhibitory peptide suggesting that dynamin 1 depletion caused deficiency in synaptic vesicle recycling not only in Drosophila but also in mammalian neurons. Collectively, these results showed that Abeta caused a disruption of synaptic vesicle endocytosis in cultured hippocampal neurons. Furthermore, we provided evidence suggesting that Abeta-induced dynamin 1 depletion might play an important role in this process.
Figures
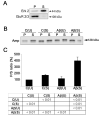
Figure 1. Aβ caused accumulation of amphiphysin at the membrane of stimulated cultured hippocampal neurons
(A) Western blot analysis showing the enrichment of Erk 2 (Erk 2) in the supernatant (S) (cytosol fraction) and GluR 2/3 (GluR 2/3) in the pellet (P) (membrane fraction) following subcellular fractionation of cultured hippocampal neurons. (B) Western blot analysis of amphiphysin (Amp) protein levels in the pellet and supernatant fractions from untreated control (C(U)), stimulated (C(S)), Aβ-treated (Aβ(U)), and Aβ-treated and stimulated (Aβ(S)) cultured hippocampal neurons. Amphiphysin distribution was assayed by determining the P/S ratio. (C) Quantitative analysis of amphiphysin distribution (P/S ratio) in cultured hippocampal neurons treated as described above. The values obtained in untreated control neurons were considered 100%. Values represent the mean ± S.E.M. Differences in the P/S ratio were assessed using ANOVA followed by Fisher’s LSD post-hoc test. The table shows the P-values of the statistical analysis.
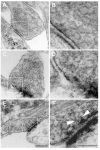
Figure 2. Aβ caused morphological signs of impaired synaptic vesicle endocytosis in stimulated cultured hippocampal neurons
Electronmicrographs of synapses from untreated control (A-B), stimulated (C-D), and Aβ-treated and stimulated (E-F) cultured hippocampal neurons. (B, D, F) Higher magnification images of the boxed areas to their left. Notice the signs synaptic vesicle pool depletion and incomplete synaptic vesicle endocytosis (arrows) in the Aβ-treated/stimulated neurons. Scale Bars: 0.20 μm (A, C, E); 0.10 μm (B, D, F)
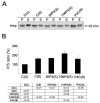
Figure 3. Dynamin 1 inhibition caused accumulation of amphiphysin at the membrane of stimulated cultured hippocampal neurons
(A) Western blot analysis of amphiphysin (Amp) protein levels in the pellet (P) and supernatant (S) fractions from untreated control (C(U)), stimulated (C(S)), or dynamin 1 inhibitor (P4)-treated and stimulated cultured hippocampal neurons. The P4 peptide was used at 50μ M (50P4(S)) and 100 μM (100P4(S)). A control P4 peptide (P4C(S)) was also used at 100 μM. (B) Quantitative analysis of amphiphysin distribution (P/S ratio) in cultured hippocampal neurons treated as described above. The values obtained in unstimulated control neurons were considered 100%. Values represent the mean ± S.E.M. Differences in the P/S ratio were assessed using ANOVA followed by Fisher’s LSD post-hoc test. The table shows the P-values of the statistical analysis.
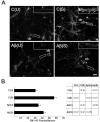
Figure 4. Aβ caused decreased uptake of FM1-43 dye in stimulated cultured hippocampal neurons
(A) Cultured hippocampal neurons were incubated with FM1-43 dye (3 μM) for 10 minutes under the following conditions: untreated controls (C(U)), stimulated (C(S)), Aβ-treated (Aβ(U)), and Aβ-treated and stimulated (Aβ(S)). Notice the increased dye uptake in the processes (shown in the inserts, arrows point to FM1-43 puncta) of the C(S) neurons when compared to the C(U) neurons and the decreased dye uptake in the processes of the Aβ(S) neurons when compared to the C(S) neurons. (B) Quantitative analysis of FM1-43 dye uptake in cultured hippocampal neurons treated as described above. Analysis was performed by quantifying FM1-43 puncta/neuron. Values represent the mean ± S.E.M. Differences in FM1-43 uptake were assessed using ANOVA followed by Fisher’s LSD post-hoc test. The table shows the P-values of the statistical analysis. cb: cell body. Scale Bar: 20 μm
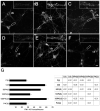
Figure 5. Dynamin 1 inhibition caused a decreased uptake of FM1-43 dye in stimulated cultured hippocampal neurons
Cultured hippocampal neurons were incubated with FM1-43 dye (3 μM) for 10 minutes under the following conditions: untreated control (A), stimulated (B), 50 μM P4-treated/stimulated (C), 100 μM P4-treated/stimulated (D), 100 μM P4C-treated/stimulated (E), and 100 μM P4C-treated (F). Notice the decreased dye uptake in the processes (shown in the inserts, arrows point to FM1-43 puncta) of the P4-treated/stimulated (C, D) neurons when compared to the stimulated (B) neurons. (G) Quantitative analysis of FM1-43 dye uptake in cultured hippocampal neurons treated as described above. Analysis was performed by quantifying FM1-43 puncta/neuron. Values represent the mean ± S.E.M. Differences in FM1-43 uptake were assessed using ANOVA followed by Fisher’s LSD post-hoc test. The table shows the P-values of the statistical analysis. cb: cell body. Scale Bar: 20 μm
Similar articles
- The novel calpain inhibitor A-705253 potently inhibits oligomeric beta-amyloid-induced dynamin 1 and tau cleavage in hippocampal neurons.
Sinjoanu RC, Kleinschmidt S, Bitner RS, Brioni JD, Moeller A, Ferreira A. Sinjoanu RC, et al. Neurochem Int. 2008 Sep;53(3-4):79-88. doi: 10.1016/j.neuint.2008.06.003. Epub 2008 Jun 12. Neurochem Int. 2008. PMID: 18590784 Free PMC article. - Beta-amyloid-induced dynamin 1 depletion in hippocampal neurons. A potential mechanism for early cognitive decline in Alzheimer disease.
Kelly BL, Vassar R, Ferreira A. Kelly BL, et al. J Biol Chem. 2005 Sep 9;280(36):31746-53. doi: 10.1074/jbc.M503259200. Epub 2005 Jul 7. J Biol Chem. 2005. PMID: 16002400 Free PMC article. - beta-Amyloid-induced dynamin 1 degradation is mediated by N-methyl-D-aspartate receptors in hippocampal neurons.
Kelly BL, Ferreira A. Kelly BL, et al. J Biol Chem. 2006 Sep 22;281(38):28079-89. doi: 10.1074/jbc.M605081200. Epub 2006 Jul 24. J Biol Chem. 2006. PMID: 16864575 - Alzheimer's disease.
De-Paula VJ, Radanovic M, Diniz BS, Forlenza OV. De-Paula VJ, et al. Subcell Biochem. 2012;65:329-52. doi: 10.1007/978-94-007-5416-4_14. Subcell Biochem. 2012. PMID: 23225010 Review. - Amyloid-β and Synaptic Vesicle Dynamics: A Cacophonic Orchestra.
Fagiani F, Lanni C, Racchi M, Pascale A, Govoni S. Fagiani F, et al. J Alzheimers Dis. 2019;72(1):1-14. doi: 10.3233/JAD-190771. J Alzheimers Dis. 2019. PMID: 31561377 Review.
Cited by
- Multiple effects of β-amyloid on single excitatory synaptic connections in the PFC.
Wang Y, Zhou TH, Zhi Z, Barakat A, Hlatky L, Querfurth H. Wang Y, et al. Front Cell Neurosci. 2013 Sep 3;7:129. doi: 10.3389/fncel.2013.00129. eCollection 2013. Front Cell Neurosci. 2013. PMID: 24027495 Free PMC article. - Increased membrane cholesterol might render mature hippocampal neurons more susceptible to beta-amyloid-induced calpain activation and tau toxicity.
Nicholson AM, Ferreira A. Nicholson AM, et al. J Neurosci. 2009 Apr 8;29(14):4640-51. doi: 10.1523/JNEUROSCI.0862-09.2009. J Neurosci. 2009. PMID: 19357288 Free PMC article. - iTRAQ analysis of complex proteome alterations in 3xTgAD Alzheimer's mice: understanding the interface between physiology and disease.
Martin B, Brenneman R, Becker KG, Gucek M, Cole RN, Maudsley S. Martin B, et al. PLoS One. 2008 Jul 23;3(7):e2750. doi: 10.1371/journal.pone.0002750. PLoS One. 2008. PMID: 18648646 Free PMC article. - Genomic convergence and network analysis approach to identify candidate genes in Alzheimer's disease.
Talwar P, Silla Y, Grover S, Gupta M, Agarwal R, Kushwaha S, Kukreti R. Talwar P, et al. BMC Genomics. 2014 Mar 15;15(1):199. doi: 10.1186/1471-2164-15-199. BMC Genomics. 2014. PMID: 24628925 Free PMC article. - Apolipoprotein E3 (ApoE3) but not ApoE4 protects against synaptic loss through increased expression of protein kinase C epsilon.
Sen A, Alkon DL, Nelson TJ. Sen A, et al. J Biol Chem. 2012 May 4;287(19):15947-58. doi: 10.1074/jbc.M111.312710. Epub 2012 Mar 17. J Biol Chem. 2012. PMID: 22427674 Free PMC article.
References
- Battaglia F, Trinchese F, Liu S, Walter S, Nixon RA, Arancio O. Calpain inhibitors, a treatment for Alzheimer’s disease: position paper. J Mol Neurosci. 2003;20:357–362. - PubMed
- Bennett JA, Dingledine R. Topology profile for a glutamate receptor: three transmembrane domains and a channel-lining reentrant membrane loop. Neuron. 1995;14:373–384. - PubMed
- Bensadoun A, Weinstein D. Assay of proteins in the presence of interfering materials. Anal Biochem. 1976;70:241–250. - PubMed
Publication types
MeSH terms
Substances
Grants and funding
- AG 20506/AG/NIA NIH HHS/United States
- NS 39080/NS/NINDS NIH HHS/United States
- R01 NS039080/NS/NINDS NIH HHS/United States
- T32 AG020506/AG/NIA NIH HHS/United States
- R01 NS039080-06/NS/NINDS NIH HHS/United States
LinkOut - more resources
Full Text Sources
Other Literature Sources
