Zinc is a novel intracellular second messenger - PubMed (original) (raw)
Zinc is a novel intracellular second messenger
Satoru Yamasaki et al. J Cell Biol. 2007.
Abstract
Zinc is an essential trace element required for enzymatic activity and for maintaining the conformation of many transcription factors; thus, zinc homeostasis is tightly regulated. Although zinc affects several signaling molecules and may act as a neurotransmitter, it remains unknown whether zinc acts as an intracellular second messenger capable of transducing extracellular stimuli into intracellular signaling events. In this study, we report that the cross-linking of the high affinity immunoglobin E receptor (Fcepsilon receptor I [FcepsilonRI]) induced a release of free zinc from the perinuclear area, including the endoplasmic reticulum in mast cells, a phenomenon we call the zinc wave. The zinc wave was dependent on calcium influx and mitogen-activated protein kinase/extracellular signal-regulated kinase kinase activation. The results suggest that the zinc wave is involved in intracellular signaling events, at least in part by modulating the duration and strength of FcepsilonRI-mediated signaling. Collectively, our findings indicate that zinc is a novel intracellular second messenger.
Figures
Figure 1.
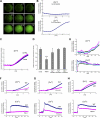
Elevation of intracellular zinc level upon FcɛRI stimulation. (A) BMMCs containing Newport green were stimulated with FcɛRI, and intracellular fluorescence was assessed every 30 s at 25°C. The numbers represent time after stimulation (in minutes). Bar, 5 μm. (B) Newport green fluorescence was quantified relative to the signal intensity of the first image observed. To rule out spontaneous Newport green elevation caused only by fluorescence emissions, a 5-min preobservation period was included. Quantification was performed for at least 10 cells in the observed field, and one representative of three independent experiments is shown. (C) The effect of a cell-impermeable zinc chelator, diethylenetriaminepentaacetic acid (DTPA), on the FcɛRI-mediated elevation of the intracellular Newport green signal. Cells were stimulated with FcɛRI in the presence or absence of 1 mM DTPA. (D) The effect of chelators for Zn2+, Fe2+, Cu2+, and Mn2+ on the FcɛRI-mediated change in the Newport green signal detected by flow cytometry. Cells were pretreated with 10 μM each of chelator and were stimulated with FcɛRI for 15 min. The affinity of TPEN for the metal ions is Ka = 1015.58 M−1, 1014.61 M−1, 1020 M−1, and 1010.27 M−1 for Zn2+, Fe2+, Cu2+, and Mn2+, respectively. We also used 2,2′-dipyridyl (_K_a = 1017.2 M−1 for Fe2+), ammonium tetrathiomolybdate, and _p_-aminosalicylic acid to chelate Fe2+, Cu2+ and Mn2+, respectively. Data are means ± SD (error bars) of three independent experiments. ***, P < 0.001 compared with no chelator (t test). (E) Newport green (for Zn2+) or Fluo-4 (for Ca2+) was incorporated into cells, and the fluorescence after stimulation was observed every 10 s. (F–H) BMMCs from Syk-, PLCγ2-, and Gab2-deficient mice containing Newport green or Fluo-4 were stimulated. One representative of three independent experiments is shown for each panel.
Figure 2.
Zinc wave requires both calcium and MAPK activation. (A) BMMCs containing Newport green or Fluo-4 were stimulated with FcɛRI in calcium-free Tyrode's buffer. (B) 10 μM IP3R inhibitor (XeC) was added 30 min before FcɛRI stimulation. (C) Zinc wave in the presence of 10 μM XeC and 300 nM ionomycin (Io). The relative fluorescence intensity 15 min after stimulation is shown. Ag represents DNP–human serum albumin stimulation–dependent FcɛRI activation. (D) Ionomycin-induced zinc and calcium waves were observed. (E) Effect of MEK1/2 inhibitors U0126 and PD98059 on zinc and calcium waves. Cells were pretreated with 50 μM U0126 or 100 μM PD98059 and Newport green for 30 min and were stimulated with FcɛRI. (F) Effect on the zinc wave of EGF stimulation and ionomycin treatment, alone and in combination, and with PD98059 pretreatment. Data are means ± SD (error bars) of three independent experiments. *, P < 0.05; **, P < 0.01 compared with no stimulation or additions (none; t test).
Figure 3.
Initiation of the zinc wave in the perinuclear region, especially near the ER. Observation of the zinc wave by a thin-layer illumination microscope system based on a TIRF microscope. (A) Simultaneous images of Newport green signals (top), ER-tracker red (middle), and merged images (bottom) in a cross section 4 μm above the bottom of the costained BMMCs. Time after FcɛRI stimulation is shown above the images. Bar, 5 μm. (B) Fluorescence intensity profile of the rectangular areas indicated in A is displayed for each time point after FcɛRI stimulation. The fluorescence intensity was vertically integrated and normalized with the maximum intensity and plotted against the horizontal distance through the selected area.
Figure 4.
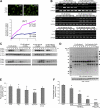
The zinc wave has a role in cytokine production through the modulation of phosphatase activity. (A) BMMCs were treated with the zinc ionophore pyrithione (Py) and ZnSO4 (Zn). Images show Newport green–containing mast cells before and after (15 min) the addition of 0.1 μM Py and 10 μM Zn. (bottom) Relative fluorescence intensity in cells treated with 10 μM Zn and 0.1 or 0.5 μM Py. (B) The effect of simultaneous zinc chelation or zinc influx with FcɛRI activation on IL-6 and TNF-α mRNA induction was determined by RT-PCR. Cells were treated with 10 μM TPEN or 10 μM Zn and 0.1 μM Py simultaneously with FcɛRI stimulation. (C) Effect of TPEN or zinc influx on FcɛRI-mediated ERK and JNK activation. Cells were treated as in B. (D) Cells were stimulated with FcɛRI, 10 μM Zn, and 0.1 μM Py for the indicated times, and protein phosphorylation was detected. Arrowheads indicate proteins showing enhanced phosphorylation. (E) Intracellular phosphatase activity was measured using phosphopeptide as a substrate. Whole-cell lysate from unstimulated (none) or FcɛRI-stimulated cells treated with 1 μM Py alone, 10 μM Zn alone, Py and Zn combined, or the combined Py and Zn with TPEN were incubated with phosphopeptide at 37°C for 30 min. (F) Phosphatase activity was measured using whole-cell lysate without any treatment, with 1 mM vanadate, or with 50–1,000 μM Zn in vitro. Data are means ± SD (error bars). *, P < 0.05; **, P < 0.01; ***, P < 0.001 compared with no stimulation or additions (none; t test).
Similar articles
- [Regulatory Mechanism of Mast Cell Activation by Zinc Signaling].
Nishida K, Uchida R. Nishida K, et al. Yakugaku Zasshi. 2017;137(5):495-501. doi: 10.1248/yakushi.16-00239-1. Yakugaku Zasshi. 2017. PMID: 28458279 Review. Japanese. - Regulation of IgE-dependent zinc release from human mast cells.
Nakashima-Kaneda K, Matsuda A, Mizuguchi H, Sasaki-Sakamoto T, Saito H, Ra C, Okayama Y. Nakashima-Kaneda K, et al. Int Arch Allergy Immunol. 2013;161 Suppl 2:44-51. doi: 10.1159/000350359. Epub 2013 May 29. Int Arch Allergy Immunol. 2013. PMID: 23711853 - Role of the FcepsilonRI beta-chain ITAM as a signal regulator for mast cell activation with monomeric IgE.
Nunomura S, Gon Y, Yoshimaru T, Suzuki Y, Nishimoto H, Kawakami T, Ra C. Nunomura S, et al. Int Immunol. 2005 Jun;17(6):685-94. doi: 10.1093/intimm/dxh248. Epub 2005 Jun 8. Int Immunol. 2005. PMID: 15944196 - Protein tyrosine phosphatase epsilon is a negative regulator of FcepsilonRI-mediated mast cell responses.
Akimoto M, Mishra K, Lim KT, Tani N, Hisanaga SI, Katagiri T, Elson A, Mizuno K, Yakura H. Akimoto M, et al. Scand J Immunol. 2009 May;69(5):401-11. doi: 10.1111/j.1365-3083.2009.02235.x. Epub 2008 Feb 6. Scand J Immunol. 2009. PMID: 19508371 - The role of sphingosine kinase in the signaling initiated at the high-affinity receptor for IgE (FcepsilonRI) in mast cells.
Baumruker T, Prieschl EE. Baumruker T, et al. Int Arch Allergy Immunol. 2000 Jun;122(2):85-90. doi: 10.1159/000024363. Int Arch Allergy Immunol. 2000. PMID: 10878486 Review.
Cited by
- Zinc deficiency as a possible risk factor for increased susceptibility and severe progression of Corona Virus Disease 19.
Wessels I, Rolles B, Slusarenko AJ, Rink L. Wessels I, et al. Br J Nutr. 2022 Jan 28;127(2):214-232. doi: 10.1017/S0007114521000738. Epub 2021 Mar 1. Br J Nutr. 2022. PMID: 33641685 Free PMC article. Review. - Bis(hinokitiolato)zinc complex ([Zn(hkt)2]) activates Akt/protein kinase B independent of insulin signal transduction.
Naito Y, Yoshikawa Y, Masuda K, Yasui H. Naito Y, et al. J Biol Inorg Chem. 2016 Jul;21(4):537-48. doi: 10.1007/s00775-016-1364-9. Epub 2016 Jun 1. J Biol Inorg Chem. 2016. PMID: 27251140 - Ion channels in innate and adaptive immunity.
Feske S, Wulff H, Skolnik EY. Feske S, et al. Annu Rev Immunol. 2015;33:291-353. doi: 10.1146/annurev-immunol-032414-112212. Annu Rev Immunol. 2015. PMID: 25861976 Free PMC article. Review. - On the genesis and unique functions of zinc neuromodulation.
Bizup B, Tzounopoulos T. Bizup B, et al. J Neurophysiol. 2024 Oct 1;132(4):1241-1254. doi: 10.1152/jn.00285.2024. Epub 2024 Aug 28. J Neurophysiol. 2024. PMID: 39196675 Review. - Zinc inhibits Hedgehog autoprocessing: linking zinc deficiency with Hedgehog activation.
Xie J, Owen T, Xia K, Singh AV, Tou E, Li L, Arduini B, Li H, Wan LQ, Callahan B, Wang C. Xie J, et al. J Biol Chem. 2015 May 1;290(18):11591-600. doi: 10.1074/jbc.M114.623264. Epub 2015 Mar 18. J Biol Chem. 2015. PMID: 25787080 Free PMC article.
References
- Aizenman, E., A.K. Stout, K.A. Hartnett, K.E. Dineley, B. McLaughlin, and I.J. Reynolds. 2000. Induction of neuronal apoptosis by thiol oxidation: putative role of intracellular zinc release. J. Neurochem. 75:1878–1888. - PubMed
- Andrews, G.K. 2001. Cellular zinc sensors: MTF-1 regulation of gene expression. Biometals. 14:223–237. - PubMed
- Armstrong, C., W. Leong, and G.J. Lees. 2001. Comparative effects of metal chelating agents on the neuronal cytotoxicity induced by copper (Cu+2), iron (Fe+3) and zinc in the hippocampus. Brain Res. 892:51–62. - PubMed
- Arslan, P., F. Di Virgilio, M. Beltrame, R.Y. Tsien, and T. Pozzan. 1985. Cytosolic Ca2+ homeostasis in Ehrlich and Yoshida carcinomas. A new, membrane-permeant chelator of heavy metals reveals that these ascites tumor cell lines have normal cytosolic free Ca2+. J. Biol. Chem. 260:2719–2727. - PubMed
- Berthet, J., T.W. Rall, and E.W. Sutherland. 1957. The relationship of epinephrine and glucagon to liver phosphorylase. IV. Effect of epinephrine and glucagon on the reactivation of phosphorylase in liver homogenates. J. Biol. Chem. 224:463–475. - PubMed
Publication types
MeSH terms
Substances
LinkOut - more resources
Full Text Sources
Other Literature Sources
Miscellaneous


