Inhibition determines membrane potential dynamics and controls action potential generation in awake and sleeping cat cortex - PubMed (original) (raw)
Comparative Study
Inhibition determines membrane potential dynamics and controls action potential generation in awake and sleeping cat cortex
Michelle Rudolph et al. J Neurosci. 2007.
Abstract
Intracellular recordings of cortical neurons in awake cat and monkey show a depolarized state, sustained firing, and intense subthreshold synaptic activity. It is not known what conductance dynamics underlie such activity and how neurons process information in such highly stochastic states. Here, we combine intracellular recordings in awake and naturally sleeping cats with computational models to investigate subthreshold dynamics of conductances and how conductance dynamics determine spiking activity. We show that during both wakefulness and the "up-states" of natural slow-wave sleep, membrane-potential activity stems from a diversity of combinations of excitatory and inhibitory synaptic conductances, with dominant inhibition in most of the cases. Inhibition also provides the largest contribution to membrane potential fluctuations. Computational models predict that in such inhibition-dominant states, spikes are preferentially evoked by a drop of inhibitory conductance, and that its signature is a transient drop of membrane conductance before the spike. This pattern of conductance change is indeed observed in estimates of spike-triggered averages of synaptic conductances during wakefulness and slow-wave sleep up states. These results show that activated states are defined by diverse combinations of excitatory and inhibitory conductances with pronounced inhibition, and that the dynamics of inhibition is particularly effective on spiking, suggesting an important role for inhibitory processes in both conscious and unconscious cortical states.
Figures
Figure 1.
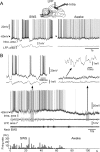
Activity of regular-spiking neurons during slow-wave sleep and wakefulness. A, Wake-active regular-spiking neuron recorded simultaneously with LFPs (diagram) during SWS and wakefulness (awake) condition. B, Wake-silent regular-spiking neuron recorded simultaneously with LFPs and EMG during slow-wave sleep to wake transition. Slow-wave sleep was characterized by high-amplitude low-frequency field potentials, cyclic hyperpolarizations, and stable muscle tone (expanded in the top left). Low-amplitude and high-frequency fluctuations of field potentials and muscle tone with periodic contractions characterized the waking state. This neuron was depolarized and fired spikes during initial 30 s of waking, then hyperpolarized spontaneously and stopped firing. A fragment of spontaneous _V_m oscillations is expanded in the top right. A period with barrages of hyperpolarizing potentials is further expanded as indicated by the arrow.
Figure 2.
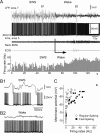
Activity of fast-spiking interneurons after awakening. A, Intracellular activity of a fast-spiking neuron recorded simultaneously with LFPs, EMG, and EOG during the transition from slow-wave sleep to wake state. The onset of the waking state is indicated by the arrow. After awakening, the mean firing rate initially remained the same as during sleep (for ∼20 s), then slightly increased (bottom, firing rate histogram). B, Fragments of LFP and neuronal activities during slow-wave sleep and waking states are expanded as indicated in A by B1 and B2. C, Comparison of firing rates of regular-spiking and fast-spiking neurons in wake states. Pooled results showing the mean firing rate of RS (open circles) and FS (filled squares) represented against the mean _V_m during waking.
Figure 3.
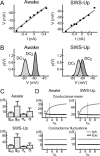
Estimation of conductances from intracellular recordings in awake and naturally sleeping cats. A, Voltage–current relationships obtained in two different cells during wakefulness (awake) and SWS-up. The average subthreshold voltage (after removing spikes) is plotted against the value of the holding current. B, Examples of _V_m distributions ρ(V) obtained in the same neurons as in A. The continuous lines show Gaussian fits of the experimental distributions. C, Conductance values (mean and SD) estimated by decomposing synaptic activity into excitatory and inhibitory components using the VmD method (applied to 28 and 26 pairings of _V_m recordings at different DC levels for awake and SWS up states, respectively). D, Variations of the value for conductance mean (top) and conductance fluctuations (bottom) as a function of different choices for the leak conductance. _r_in = _R_in(quiescent)/_R_in(active); asterisks indicate the region with high leak conductances in which excitation is larger than inhibition; the gray area shows the _r_in values used for the conductance estimates in C. Error bars indicate SD.
Figure 4.
Conductance estimates in cortical neurons during wake and sleep states. A, Average _V_m, _V_m fluctuation amplitude, and absolute input resistance _R_in during wakefulness (awake), SWS-up, and REM sleep periods, computed from all cells for which synaptic conductances were estimated. B, Spread of excitatory (_ge_0) and inhibitory (_gi_0) conductance mean during wakefulness and slow-wave sleep up states. Estimated conductance values show a high variability among the investigated cells, but in almost all states, a dominance of inhibition was observed. C, Box plots of mean excitatory and inhibitory conductance estimates (left) and average ratio between inhibitory and excitatory mean (right) observed during wakefulness and slow-wave sleep up states for the population shown in B. In both states, dominant inhibition was observed, an effect that was more pronounced during SWS-up. D, Variations of the ratio between inhibitory and excitatory mean conductance values as a function of different choices for the leak conductance. _r_in = _R_in(quiescent)/_R_in(active); the gray area indicates the values used for conductance estimation plotted in B and C. E, Histograms of conductance values relative to the leak conductance during the wake state. Error bars indicate SD.
Figure 5.
Estimates of conductance fluctuations from cortical neurons during wake and sleep states. A, Spread of excitatory (ς_e_) and inhibitory (ς_i_) conductance fluctuations during wakefulness and slow-wave sleep up states. Estimated conductance values show a high variability among the investigated cells, but in all states a dominance of inhibition was observed. B, Box plots of excitatory and inhibitory conductance fluctuation amplitude (left) and average ratio between inhibitory and excitatory SD (right) observed during wakefulness (awake) and SWS-up for population shown in A. In all cases, dominant inhibition was observed. C, In the VmD method, estimated values for the ratio between inhibitory and excitatory conductance fluctuations do not depend on different choices for the leak conductance. _r_in = _R_in(quiescent)/_R_in(active). Error bars indicate SD.
Figure 6.
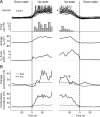
Conductance time course during up and down states during slow-wave sleep. A, Superimposed intracellular traces during transitions from down to up states (left), and up to down states (right). B, Time course of global synaptic conductances during down–up and up–down transitions. Conductance changes were evaluated relative to the average conductance of the down state. Top, Excitatory (ge, gray) and inhibitory (gi, black) conductances; asterisk indicates a drop of inhibitory conductance before the up–down transition. Bottom, SD of the conductances for excitation (ς_e_, gray) and inhibition (ς_i_, black). Both are shown at the same time reference as for A.
Figure 7.
Model of conductance interplay during wakefulness and the up states of slow-wave sleep. A, Simulated intracellular activity corresponding to measurements in the wake state (based on conductance values shown in Fig. 3_C_; leak conductance of 13.4 nS). B, Simulated up and down state transitions (based on the values given in Fig. 6_B_). C, _V_m distributions obtained in the model (solid lines) compared with that of the experiments (gray) in the same conditions (DC injection of −0.5 and −0.43 nA, respectively).
Figure 8.
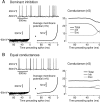
Model prediction of conductance variations preceding spikes. A, Simulated waking state with dominant inhibition as in Figure 7_A_ (top). Left, Selection of 40 spikes; middle, STA of the V_m_; right, STAs of excitatory (Exc), inhibitory (Inh), and total conductance. Spikes were correlated with a previous increase of excitation, a decrease of inhibition, and a decrease of the total conductance. B, Same STA procedure from a state that displayed comparable _V_m fluctuations and spiking activity as in A, but where excitatory and inhibitory conductances had the same mean value. The latter state was of lower overall conductance compared with A, and spikes were correlated with an increase of membrane conductance.
Figure 9.
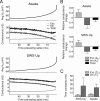
Decrease of membrane conductance preceding spikes in wake and sleep states. A, STA for the membrane potential (Avg V_m) as well as excitatory (Exc), inhibitory (Inh), and total conductances obtained from intracellular data of regular-spiking neurons in an awake (top) and sleeping (SWS-up, bottom) cat. The estimated conductance time courses showed in both cases a drop of the total conductance caused by a marked drop of inhibitory conductance within ∼20 ms before the spike. B, Average value for the relative conductance change (ke and ki) triggering spikes during wakefulness (top) and up-states during SWS (bottom) obtained from exponential fits of the STA conductance time course (using Eq. 3) for all investigated cells. A decrease of the total membrane conductance and of the inhibitory conductance is correlated with spike generation, similar to the model (Fig. 8_A) (estimated values: ke = 0.41 ± 0.23, ki = −0.59 ± 0.29; total change, −0.17 ± 0.18 for awake, ke = 0.33 ± 0.19, ki = −0.40 ± 0.13; −0.20 ± 0.13 for SWS-up). C, Time constants of average excitatory and inhibitory conductance time course ahead of a spike in SWS and wake states (estimated values: Te = 4.3 ± 2.0 ms, Ti = 26.3 ± 19.0 ms for SWS; Te = 6.2 ± 2.8, Ti = 22.3 ± 7.9 ms for awake). Error bars indicate SD.
Figure 10.
Relationship between conductance STA and the estimates of conductance and variances. A, Relationship between total membrane conductance change before the spike (relative conductance change; Eq. 4) obtained from STA analysis, and the difference of excitatory and inhibitory conductance (relative excess conductance; Eq. 5) estimated using the VmD method. Most cells are situated in the bottom-left quadrant (gray), indicating a relationship between inhibitory-dominant states and a drop of membrane conductance before the spike. B, Relationship between relative conductance change before the spike and conductance fluctuations, expressed as the difference between excitatory and inhibitory fluctuations (relative excess conductance fluctuations; Eq. 6). Here, a clear correlation (gray area) shows that the magnitude of the conductance change before the spike is related to the amplitude of conductance fluctuations. Open circles, Wake; gray circles, SWS-up; black circles, REM. For definitions, see Materials and Methods.
Similar articles
- Activated cortical states: experiments, analyses and models.
El Boustani S, Pospischil M, Rudolph-Lilith M, Destexhe A. El Boustani S, et al. J Physiol Paris. 2007 Jan-May;101(1-3):99-109. doi: 10.1016/j.jphysparis.2007.10.001. Epub 2007 Oct 16. J Physiol Paris. 2007. PMID: 18023562 Review. - Rapid developmental emergence of stable depolarization during wakefulness by inhibitory balancing of cortical network excitability.
Colonnese MT. Colonnese MT. J Neurosci. 2014 Apr 16;34(16):5477-85. doi: 10.1523/JNEUROSCI.3659-13.2014. J Neurosci. 2014. PMID: 24741038 Free PMC article. - Stimulus-selective spiking is driven by the relative timing of synchronous excitation and disinhibition in cat striate neurons in vivo.
Azouz R, Gray CM. Azouz R, et al. Eur J Neurosci. 2008 Oct;28(7):1286-300. doi: 10.1111/j.1460-9568.2008.06434.x. Eur J Neurosci. 2008. PMID: 18973556 - Orientation and direction selectivity of synaptic inputs in visual cortical neurons: a diversity of combinations produces spike tuning.
Monier C, Chavane F, Baudot P, Graham LJ, Frégnac Y. Monier C, et al. Neuron. 2003 Feb 20;37(4):663-80. doi: 10.1016/s0896-6273(03)00064-3. Neuron. 2003. PMID: 12597863 - Physiology of sleep and wakefulness as it relates to the physiology of epilepsy.
Amzica F. Amzica F. J Clin Neurophysiol. 2002 Dec;19(6):488-503. doi: 10.1097/00004691-200212000-00002. J Clin Neurophysiol. 2002. PMID: 12488780 Review.
Cited by
- Horizontal cortical connections shape intrinsic traveling waves into feature-selective motifs that regulate perceptual sensitivity.
Davis ZW, Busch A, Steward C, Muller L, Reynolds J. Davis ZW, et al. Cell Rep. 2024 Sep 24;43(9):114707. doi: 10.1016/j.celrep.2024.114707. Epub 2024 Sep 6. Cell Rep. 2024. PMID: 39243374 Free PMC article. - Six principles of visual cortical dynamics.
Roland PE. Roland PE. Front Syst Neurosci. 2010 Jul 2;4:28. doi: 10.3389/fnsys.2010.00028. eCollection 2010. Front Syst Neurosci. 2010. PMID: 20661451 Free PMC article. - How far neuroscience is from understanding brains.
Roland PE. Roland PE. Front Syst Neurosci. 2023 Oct 5;17:1147896. doi: 10.3389/fnsys.2023.1147896. eCollection 2023. Front Syst Neurosci. 2023. PMID: 37867627 Free PMC article. - Neuronal plasticity and thalamocortical sleep and waking oscillations.
Timofeev I. Timofeev I. Prog Brain Res. 2011;193:121-44. doi: 10.1016/B978-0-444-53839-0.00009-0. Prog Brain Res. 2011. PMID: 21854960 Free PMC article. Review. - Neocortical inhibitory activities and long-range afferents contribute to the synchronous onset of silent states of the neocortical slow oscillation.
Lemieux M, Chauvette S, Timofeev I. Lemieux M, et al. J Neurophysiol. 2015 Feb 1;113(3):768-79. doi: 10.1152/jn.00858.2013. Epub 2014 Nov 12. J Neurophysiol. 2015. PMID: 25392176 Free PMC article.
References
- Anderson JS, Carandini M, Ferster D. Orientation tuning of input conductance, excitation and inhibition in cat primary visual cortex. J Neurophysiol. 2000;84:909–926. - PubMed
- Baranyi A, Szente MB, Woody CD. Electrophysiological characterization of different types of neurons recorded in vivo in the motor cortex of the cat. II. Membrane parameters, action potentials, current-induced voltage responses and electrotonic structures. J Neurophysiol. 1993;69:1865–1879. - PubMed
- Borg-Graham LJ, Monier C, Frégnac Y. Visual input evokes transient and strong shunting inhibition in visual cortical neurons. Nature. 1998;393:369–373. - PubMed
- Brecht M, Schneider M, Sakmann B, Margrie TW. Whisker movements evoked by stimulation of single pyramidal cells in rat motor cortex. Nature. 2004;427:704–710. - PubMed
- Destexhe A, Paré D. Impact of network activity on the integrative properties of neocortical pyramidal neurons in vivo. J Neurophysiol. 1999;81:1531–1547. - PubMed
Publication types
MeSH terms
LinkOut - more resources
Full Text Sources
Molecular Biology Databases
Miscellaneous
