Monitoring synaptic function at the neuromuscular junction of a mouse expressing synaptopHluorin - PubMed (original) (raw)
Comparative Study
Monitoring synaptic function at the neuromuscular junction of a mouse expressing synaptopHluorin
Lucia Tabares et al. J Neurosci. 2007.
Abstract
We monitored presynaptic exocytosis and vesicle recycling at neuromuscular junctions of transgenic mice expressing synaptopHluorin (spH), using simultaneous optical and electrophysiological recordings. Synaptic transmission was indistinguishable from that in wild-type controls. Fluorescence rose during and decayed monotonically after stimulus trains to the nerve, with amplitudes and decay times increasing with the amount of stimulation. The relatively large size of synaptic terminals allowed us to examine the spatial profile of fluorescence changes. We identified hot spots of exocytosis, which were stable with repeated trains. Photobleach experiments showed that spH freshly exposed by nerve stimulation was not preferentially retrieved by compensatory endocytosis; instead, most retrieved spH preexisted in the surface membrane. Finally, we compared fluorescence and electrical [summed end-plate potentials (EPPs)] estimates of exocytosis, which diverged during repeated trains, as fluorescence exceeded summed EPPs, although the average amplitude of miniature EPPs was unchanged. This might reflect exocytosis of spH-containing, acetylcholine-free ("empty") vesicles or other organelles during intense stimulation.
Figures
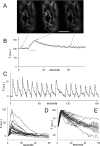
Figure 1.
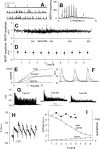
SynaptopHluorin fluorescence reliably reflects nerve stimulation. A, Transgenic mouse motor nerve terminal expressing spH before stimulation (left), at the end of a stimulus train (100 Hz for 8 s; middle), and 1 min after the train ended (right). Images were background subtracted. Scale bar, 10 μm. B, The average fluorescence (F) of the terminal, which increased ∼50% during the train (horizontal bar) and then decayed exponentially with a time constant of 14 s. C, The robust reliability of the fluorescence rise during repeated trains (each 100 Hz for 0.5 s) is clearly evident. Successive peak amplitudes decayed by ∼3%. D, Fluorescence of 23 different terminals (background subtracted), offset (no scaling) to equal zero immediately before the train. Open circles show mean ± SEM. E, Same data as D, normalized to peak F values to show variation in recovery after the stimulus train ended. The best-fit exponential (open circles) has a decay time constant of 27 s (_r_2 = 0.996). a.u., Arbitrary units.
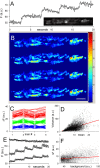
Figure 2.
Spatial analysis of exocytic hot spots. A, Fluorescence responses (averaged over the entire terminal) to four stimulus trains (each 100 Hz for 0.5 s). Inset, Image of resting terminal. The bright spot near the center (*) showed no fluorescence increase during nerve stimulation. B, Fluorescence increases (difference between average of last 3 control images before train and average of 3 images at the peak of fluorescence) are shown for each of the four trains on a pixel-by-pixel basis. Regions of large increases (red) tended to recur at the same positions for each train. Scale bar, 10 μm. C, The images from B were aligned, and pixels at the same positions within the boundaries of the terminal (n = 3806 pixels) were averaged. The 50 positions with the highest average fluorescence increase were identified, and the individual pixel values from each train were plotted (red). The same procedure was followed for the positions with lowest (blue) and middle (green) rises in fluorescence. The graph shows that pixel values in one train predict pixel values in all trains. D, The mean-variance scatter plot for each pixel position shows a reasonably strong correlation (_r_2 = 0.59), again suggesting consistent responses from train to train. E, The fluorescence of three spots are plotted. The spot with the highest fluorescence at the outset (* in A) showed no response at all during stimulation, whereas the much dimmer spots showed robust responses. F, Pixel-by-pixel scatter plot of initial background fluorescence versus rise in fluorescence during stimulation shows virtually no correlation (_r_2 = 0.02). a.u., Arbitrary units.
Figure 3.
Fluorescence decay rates are faster at exocytic hot spots. A, Image of terminal before stimulation. Scale bar, 10 μm. B, Average fluorescence of entire terminal before, during, and after stimulus train (100 Hz for 2 s). C, Pixel-by-pixel increases in fluorescence during stimulus train (as in Fig. 2_B_). D, Pixel-by-pixel rates of fluorescence decay (a.u./s) after stimulus train, obtained from best linear fits to data from frame 17 to the last frame. E, Pixel-by-pixel correlation coefficients (_r_2) for linear fits to fluorescence decay. F, Scatter plot showing relation between amplitude of fluorescence rise (_x_-axis) and subsequent fluorescence decay rate (_y_-axis) for each pixel. a.u., Arbitrary units.
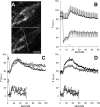
Figure 4.
spH newly exposed by nerve stimulation is not recycled in preference to spH preexisting on the surface. A, Fluorescence images of terminal before (top) and after (bottom) a bleach of surface spH. The terminal area to the right of the white line was bleached. Scale bar, 10 μm. B, One stimulus train. Average ± SEM fluorescence of two regions, one control (nonbleached; filled circles) and one bleached (open circles). After the bleach (given at t = 4 s), but before nerve stimulation started (at t = 12 s), surface fluorescence recovered with a time constant of 2.1 s (solid line). Nerve stimulation (100 Hz for 5 s; horizontal bar) caused approximately equal increases in fluorescence in both control and bleached regions, but the fluorescence decay after stimulation ended was much slower in the bleached region: best-fit single-exponential time constants were 20 s (control) and 112 s (bleached); expressed alternatively, 30 s after the end of the stimulus train, the amount of recovery was 100% (control) and 22% (bleached). The solid line shows background (surface) fluorescence. Data are from nine terminals in three muscles. C, Bleaching did not inhibit exocytosis. Two stimulus trains were given; part of the terminal was bleached shortly before the second train. spH signals were measured from the same region before (filled circles) and after (open circles) bleaching of that region. Stimulus trains were 100 Hz for 30 s (top pair) or 5 s (bottom pair), separated by 20 or 5 min, respectively. In both cases, the amplitudes of the fluorescence increases were nearly identical for control and postbleach trains. The decay rate of fluorescence was slower after the bleach, as in A. For each postbleach response, a constant was added (no scaling) so that traces superimposed immediately before each train. D, Bleaching did not inhibit requenching. The protocol was like C, with an additional (third) stimulus train given after a rest period. Filled circles show control (prebleach) responses. Open circles show responses to the last train (responses to the second train are not shown). The fluorescence decay rates were not significantly different: best-fit single-exponential time constants (smooth lines) were 27 s for control (top) and 31 s for third train (bottom; _r_2 = 0.95 and 0.83, respectively), showing that bleaching did not interfere with requenching. In addition, the exocytic response amplitude was significantly reduced after bleaching in the top pair (30 s train), suggesting that released vesicles contained bleached spH that was retrieved after the second train and trafficked back to the recycling pool. In C and D, 30 s stimulation traces are typical results, whereas 5 s traces are averages of at least two experiments. a.u., Arbitrary units.
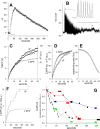
Figure 5.
Combined electrophysiological and fluorescence estimates of transmitter secretion during prolonged stimulation do not agree. A, Fluorescence changes during a 50 s stimulus train (100 Hz; marked by horizontal line). B, EPPs recorded during the train. Insets, Sample EPPs (at times marked by arrows) at expanded time scale (10 ms between successive EPPs). During the train, EPPs declined and disappeared into the recording noise. C, Summed EPPs (smooth lines) and fluorescence (filled circles) during the stimulus train, plotted on separate axes (both linear, starting at zero). EPP amplitudes were summed after correction for nonlinear voltage summation using reversal potentials of 0 mV (bottom smooth line) or −10 mV (top smooth line). Raw fluorescence change (bottom filled circle trace) was corrected for endocytosis and reacidification (top filled circle trace), using a fluorescence decay rate (0.2 a.u./s) obtained from a linear fit to the observed fluorescence decay after the end of stimulation (A). The EPP and fluorescence curves superimpose well at early times but deviate significantly after 15–20 s of stimulation, with summed EPPs falling below the fluorescence. D, An alternative scaling method, in which the last rather than the first points in the summed EPP and fluorescence curves were superimposed with a single scaling factor. Now, the fluorescence falls below the summed EPP curve. The curves were each fitted by single rising exponentials (smooth lines). The fluorescence curve was then increased point by point to equal the summed EPP curve, by assuming that some fluorescence escaped full detection because of rapid endocytosis and requenching. E, Percentage of total exocytosis that would be required to be requenched in one second to explain the discrepancy between the two curves. The high amount required makes this an unlikely explanation. F, The fluorescence–ΣEPP disparity persisted with multiple short trains (each marked by an upward jump in the data). The fluorescence increases (top trace; no correction for requenching) and summed EPPs (bottom trace, assuming −10 mV reversal potential) produced by each train were each added and scaled to superimpose after the first train. Subsequently and progressively, the EPP curve fell below the fluorescence curve. Train durations were 2 s (first 12), 4 s (next 3), and 10 s (last 2). G, Results from F (bottom black trace) and four other experiments, in which the ratio of summed EPPs to fluorescence change are plotted for each train, normalized to a value of 1.0 for the first train. Different colors are used for clarity. The duration of each train is equal to the width of the symbol. Trains were 2, 4, 10, or 16 s in duration. EPPs were corrected for nonlinear voltage summation assuming a reversal potential of −10 mV; fluorescence changes were corrected for endocytosis as in C. A clear decrease in the ratio is evident in every experiment. a.u., Arbitrary units.
Figure 6.
The fluorescence–ΣEPP discrepancy exists without significant changes in MEPP amplitudes. A, Sample MEPPs recorded at times marked by arrows in B. Calibration: 1 mV, 1 s. B, MEPP frequency transiently increased during and after each train. Arrows mark times sampled in A. C, MEPP amplitudes during the entire experiment (moving bin average of 9 consecutive MEPPs). Trains were delivered at times marked by short bars. D, Average ± SD amplitudes of MEPPs before first stimulus train, between each train, and after last train. E, Total quanta released asynchronously and by nerve stimulation, and their sum. MEPPs were measured during and between trains. F, Sample recordings taken at early (top trace), middle (middle trace), and late (lowest trace) times during train 6 (see arrows in G). Evoked responses were 10 ms apart. The increased frequency of asynchronous release during the later stages is evident. G, EPPs recorded during trains 1, 6, and 9. The arrows in the middle panel show the times at which recordings in F were taken. H, Fluorescence changes during six consecutive, identical stimulus trains (100 Hz for 2 s). The downward deflection at the start of each train is caused by a slight movement artifact. Fluorescence baseline for each train was measured from the preceding point. I, Fluorescence change per train (filled circles) remained nearly constant, whereas total quanta (large circles) progressively declined. a.u., Arbitrary units.
Similar articles
- Heterogeneity in synaptic vesicle release at neuromuscular synapses of mice expressing synaptopHluorin.
Wyatt RM, Balice-Gordon RJ. Wyatt RM, et al. J Neurosci. 2008 Jan 2;28(1):325-35. doi: 10.1523/JNEUROSCI.3544-07.2008. J Neurosci. 2008. PMID: 18171949 Free PMC article. - The spatial pattern of exocytosis and post-exocytic mobility of synaptopHluorin in mouse motor nerve terminals.
Gaffield MA, Tabares L, Betz WJ. Gaffield MA, et al. J Physiol. 2009 Mar 15;587(Pt 6):1187-200. doi: 10.1113/jphysiol.2008.166728. Epub 2009 Jan 19. J Physiol. 2009. PMID: 19153160 Free PMC article. - Optical monitoring of transmitter release and synaptic vesicle recycling at the frog neuromuscular junction.
Betz WJ, Bewick GS. Betz WJ, et al. J Physiol. 1993 Jan;460:287-309. doi: 10.1113/jphysiol.1993.sp019472. J Physiol. 1993. PMID: 8387585 Free PMC article. - Exocytosis and endocytosis of synaptic vesicles and functional roles of vesicle pools: lessons from the Drosophila neuromuscular junction.
Kuromi H, Kidokoro Y. Kuromi H, et al. Neuroscientist. 2005 Apr;11(2):138-47. doi: 10.1177/1073858404271679. Neuroscientist. 2005. PMID: 15746382 Review. - Mammalian neuromuscular junctions: modern tools to monitor synaptic form and function.
Ribchester RR. Ribchester RR. Curr Opin Pharmacol. 2009 Jun;9(3):297-305. doi: 10.1016/j.coph.2009.03.006. Epub 2009 Apr 23. Curr Opin Pharmacol. 2009. PMID: 19394273 Review.
Cited by
- Brain derived neurotrophic factor/tropomyosin related kinase B signaling impacts diaphragm neuromuscular transmission in a novel rat chemogenetic model.
Fogarty MJ, Khurram OU, Mantilla CB, Sieck GC. Fogarty MJ, et al. Front Cell Neurosci. 2022 Oct 28;16:1025463. doi: 10.3389/fncel.2022.1025463. eCollection 2022. Front Cell Neurosci. 2022. PMID: 36385943 Free PMC article. - Calcium control of endocytic capacity at a CNS synapse.
Balaji J, Armbruster M, Ryan TA. Balaji J, et al. J Neurosci. 2008 Jun 25;28(26):6742-9. doi: 10.1523/JNEUROSCI.1082-08.2008. J Neurosci. 2008. PMID: 18579748 Free PMC article. - Different dynamin blockers interfere with distinct phases of synaptic endocytosis during stimulation in motoneurones.
Linares-Clemente P, Rozas JL, Mircheski J, García-Junco-Clemente P, Martínez-López JA, Nieto-González JL, Vázquez ME, Pintado CO, Fernández-Chacón R. Linares-Clemente P, et al. J Physiol. 2015 Jul 1;593(13):2867-88. doi: 10.1113/JP270112. Epub 2015 Jun 10. J Physiol. 2015. PMID: 25981717 Free PMC article. - Synaptic vesicle pools: an update.
Denker A, Rizzoli SO. Denker A, et al. Front Synaptic Neurosci. 2010 Oct 5;2:135. doi: 10.3389/fnsyn.2010.00135. eCollection 2010. Front Synaptic Neurosci. 2010. PMID: 21423521 Free PMC article. - Vesicular ATPase inserted into the plasma membrane of motor terminals by exocytosis alkalinizes cytosolic pH and facilitates endocytosis.
Zhang Z, Nguyen KT, Barrett EF, David G. Zhang Z, et al. Neuron. 2010 Dec 22;68(6):1097-108. doi: 10.1016/j.neuron.2010.11.035. Neuron. 2010. PMID: 21172612 Free PMC article.
References
- Bozza T, McGann JP, Mombaerts P, Wachowiak M. In vivo imaging of neuronal activity by targeted expression of a genetically encoded probe in the mouse. Neuron. 2004;42:9–21. - PubMed
- Caroni P. Overexpression of growth-associated proteins in the neurons of adult transgenic mice. J Neurosci Methods. 1997;71:3–9. - PubMed
- Fernandez-Alfonso T, Kwan R, Ryan TA. Synaptic vesicles interchange their membrane proteins with a large surface reservoir during recycling. Neuron. 2006;51:179–186. - PubMed
Publication types
MeSH terms
Substances
LinkOut - more resources
Full Text Sources
Other Literature Sources
Molecular Biology Databases
