A method to address differential bias in genotyping in large-scale association studies - PubMed (original) (raw)
A method to address differential bias in genotyping in large-scale association studies
Vincent Plagnol et al. PLoS Genet. 2007.
Abstract
In a previous paper we have shown that, when DNA samples for cases and controls are prepared in different laboratories prior to high-throughput genotyping, scoring inaccuracies can lead to differential misclassification and, consequently, to increased false-positive rates. Different DNA sourcing is often unavoidable in large-scale disease association studies of multiple case and control sets. Here, we describe methodological improvements to minimise such biases. These fall into two categories: improvements to the basic clustering methods for identifying genotypes from fluorescence intensities, and use of "fuzzy" calls in association tests in order to make appropriate allowance for call uncertainty. We find that the main improvement is a modification of the calling algorithm that links the clustering of cases and controls while allowing for different DNA sourcing. We also find that, in the presence of different DNA sourcing, biases associated with missing data can increase the false-positive rate. Therefore, we propose the use of "fuzzy" calls to deal with uncertain genotypes that would otherwise be labeled as missing.
Conflict of interest statement
Competing interests. The authors have declared that no competing interests exist.
Figures
Figure 1
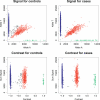
Example of Biased Association Statistic Resulting from Missing Data in the MIP nsSNPs Dataset The top row shows the normalised fluorescent signal intensities for both alleles. The bottom row shows the contrasts (_x_-axis) plotted against the sum signal (_y_-axis). Clustering is based on the original Moorhead et al. [5] algorithm: blue and green crosses belong to both homozygous clouds, red to the heterozygous cloud and black indicates missing calls. The _p_-value for the association test is 0.036 using the original Moorhead et al. [5] algorithm and 0.55 using our modified procedure (which does not label any of the calls as missing).
Figure 2
Quantile–Quantile Plot Comparing the Observed Distribution of the Association Statistic (_y_-Axis) with the Predicted Distribution under the Null (_x_-Axis) The leftmost graph uses our set of calls for our best 7,446 nsSNPs and the rightmost graph relies on the original calls for the best 5,294 nsSNPs in 3,750 cases and 3,480 controls.
Figure 3
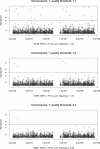
Distribution of _p_-Values for the Association Test between the 1958 BBC Samples and the UK Blood Donors (WTCCC Control Dataset) for Three Different Quality Thresholds
Similar articles
- Missing call bias in high-throughput genotyping.
Fu W, Wang Y, Wang Y, Li R, Lin R, Jin L. Fu W, et al. BMC Genomics. 2009 Mar 13;10:106. doi: 10.1186/1471-2164-10-106. BMC Genomics. 2009. PMID: 19284636 Free PMC article. - Population structure, differential bias and genomic control in a large-scale, case-control association study.
Clayton DG, Walker NM, Smyth DJ, Pask R, Cooper JD, Maier LM, Smink LJ, Lam AC, Ovington NR, Stevens HE, Nutland S, Howson JM, Faham M, Moorhead M, Jones HB, Falkowski M, Hardenbol P, Willis TD, Todd JA. Clayton DG, et al. Nat Genet. 2005 Nov;37(11):1243-6. doi: 10.1038/ng1653. Epub 2005 Oct 9. Nat Genet. 2005. PMID: 16228001 - The impact of missing and erroneous genotypes on tagging SNP selection and power of subsequent association tests.
Liu W, Zhao W, Chase GA. Liu W, et al. Hum Hered. 2006;61(1):31-44. doi: 10.1159/000092141. Epub 2006 Mar 23. Hum Hered. 2006. PMID: 16557026 - Bias Characterization in Probabilistic Genotype Data and Improved Signal Detection with Multiple Imputation.
Palmer C, Pe'er I. Palmer C, et al. PLoS Genet. 2016 Jun 16;12(6):e1006091. doi: 10.1371/journal.pgen.1006091. eCollection 2016 Jun. PLoS Genet. 2016. PMID: 27310603 Free PMC article. - Dynamic variable selection in SNP genotype autocalling from APEX microarray data.
Podder M, Welch WJ, Zamar RH, Tebbutt SJ. Podder M, et al. BMC Bioinformatics. 2006 Nov 30;7:521. doi: 10.1186/1471-2105-7-521. BMC Bioinformatics. 2006. PMID: 17137502 Free PMC article.
Cited by
- Single-variant and multi-variant trend tests for genetic association with next-generation sequencing that are robust to sequencing error.
Kim W, Londono D, Zhou L, Xing J, Nato AQ, Musolf A, Matise TC, Finch SJ, Gordon D. Kim W, et al. Hum Hered. 2012;74(3-4):172-83. doi: 10.1159/000346824. Epub 2013 Apr 11. Hum Hered. 2012. PMID: 23594495 Free PMC article. - Perturbation analysis: a simple method for filtering SNPs with erroneous genotyping in genome-wide association studies.
Teo YY, Small KS, Clark TG, Kwiatkowski DP. Teo YY, et al. Ann Hum Genet. 2008 May;72(Pt 3):368-74. doi: 10.1111/j.1469-1809.2007.00422.x. Epub 2008 Feb 6. Ann Hum Genet. 2008. PMID: 18261185 Free PMC article. - Robust associations of four new chromosome regions from genome-wide analyses of type 1 diabetes.
Todd JA, Walker NM, Cooper JD, Smyth DJ, Downes K, Plagnol V, Bailey R, Nejentsev S, Field SF, Payne F, Lowe CE, Szeszko JS, Hafler JP, Zeitels L, Yang JH, Vella A, Nutland S, Stevens HE, Schuilenburg H, Coleman G, Maisuria M, Meadows W, Smink LJ, Healy B, Burren OS, Lam AA, Ovington NR, Allen J, Adlem E, Leung HT, Wallace C, Howson JM, Guja C, Ionescu-Tîrgovişte C; Genetics of Type 1 Diabetes in Finland; Simmonds MJ, Heward JM, Gough SC; Wellcome Trust Case Control Consortium; Dunger DB, Wicker LS, Clayton DG. Todd JA, et al. Nat Genet. 2007 Jul;39(7):857-64. doi: 10.1038/ng2068. Epub 2007 Jun 6. Nat Genet. 2007. PMID: 17554260 Free PMC article. - STrengthening the REporting of Genetic Association studies (STREGA)--an extension of the STROBE statement.
Little J, Higgins JP, Ioannidis JP, Moher D, Gagnon F, von Elm E, Khoury MJ, Cohen B, Davey-Smith G, Grimshaw J, Scheet P, Gwinn M, Williamson RE, Zou GY, Hutchings K, Johnson CY, Tait V, Wiens M, Golding J, van Duijn C, McLaughlin J, Paterson A, Wells G, Fortier I, Freedman M, Zecevic M, King R, Infante-Rivard C, Stewart A, Birkett N. Little J, et al. Eur J Clin Invest. 2009 Apr;39(4):247-66. doi: 10.1111/j.1365-2362.2009.02125.x. Eur J Clin Invest. 2009. PMID: 19297801 Free PMC article. - Missing call bias in high-throughput genotyping.
Fu W, Wang Y, Wang Y, Li R, Lin R, Jin L. Fu W, et al. BMC Genomics. 2009 Mar 13;10:106. doi: 10.1186/1471-2164-10-106. BMC Genomics. 2009. PMID: 19284636 Free PMC article.
References
- Wang WY, Barratt BJ, Clayton DG, Todd JA. Genome-wide association studies: Theoretical and practical concerns. Nat Rev Genet. 2005;6:109–118. - PubMed
- Clayton DG, Walker NM, Smyth DJ, Pask R, Cooper JD, et al. Population structure, differential bias and genomic control in a large-scale, case-control association study. Nat Genet. 2005;37:1243–1246. - PubMed
- Power C, Elliott J. Cohort profile: 1958 British Birth Cohort (National Child Development Study) Int J Epidemiol. 2006;35:34–41. - PubMed
- Moorhead M, Hardenbol P, Siddiqui F, Falkowski M, Bruckner C, et al. Optimal genotype determination in highly multiplexed SNP data. Eur J Hum Genet. 2006;14:207–215. - PubMed
Publication types
MeSH terms
LinkOut - more resources
Full Text Sources
Miscellaneous


