Loss of Nocturnin, a circadian deadenylase, confers resistance to hepatic steatosis and diet-induced obesity - PubMed (original) (raw)
Loss of Nocturnin, a circadian deadenylase, confers resistance to hepatic steatosis and diet-induced obesity
Carla B Green et al. Proc Natl Acad Sci U S A. 2007.
Abstract
The mammalian circadian system consists of a central oscillator in the suprachiasmatic nucleus of the hypothalamus, which coordinates peripheral clocks in organs throughout the body. Although circadian clocks control the rhythmic expression of a large number of genes involved in metabolism and other aspects of circadian physiology, the consequences of genetic disruption of circadian-controlled pathways remain poorly defined. Here we report that the targeted disruption of Nocturnin (Ccrn4l) in mice, a gene that encodes a circadian deadenylase, confers resistance to diet-induced obesity. Mice lacking Nocturnin remain lean on high-fat diets, with lower body weight and reduced visceral fat. However, unlike lean lipodystrophic mouse models, these mice do not have fatty livers and do not exhibit increased activity or reduced food intake. Gene expression data suggest that Nocturnin knockout mice have deficits in lipid metabolism or uptake, in addition to changes in glucose and insulin sensitivity. Our data support a pivotal role for Nocturnin downstream of the circadian clockwork in the posttranscriptional regulation of genes necessary for nutrient uptake, metabolism, and storage.
Conflict of interest statement
The authors declare no conflict of interest.
Figures
Fig. 1.
_Noc_−/− mice exhibit a diet-dependent lean phenotype. (A) _Noc_−/− mice have decreased lipid accumulation in livers. Livers were stained with ORO, and the area fraction of ORO staining was determined in liver chords surrounding portal and central veins separately by using size-calibrated images and Image J software. The values represent group means (± SEM) of sections from six mice per genotype [t test: P = 0.0035 for portal area; not significant (P = 0.06) for central area]. (B) Body weights of male WT (filled symbols) and _Noc_−/− (open symbols) mice from 4 to 13 weeks with ad libitum access to the standard diet were not different (WT, n = 24; _Noc_−/−, n = 36; analysis of covariance: _F_1,59 = 0.1222, P = 0.728). (C) Male WT mice (filled symbols) gained more weight than male _Noc_−/− mice (open symbols) when given ad libitum access to a high-fat diet (WT, n = 8; _Noc_−/−, n = 12) for 14 weeks beginning at 8 weeks of age (repeated-measures ANOVA: P = 0.042). Values are group means ± SEM. (D) Photograph of age-matched WT and _Noc_−/− mice showing body size differences after 20 weeks on the high-fat diet. (E) _Noc_−/− livers at 20 weeks did not accumulate excess fat on the high-fat diet. Greater accumulation of lipid in WT (Left) compared with _Noc_−/− (Right) livers at the macroscopic level (Upper) and in ORO-stained sections (Lower) was observed. (F) Epididymal fat pads dissected at ZT1 from _Noc_−/− mice (open bars) on a high-fat diet are significantly smaller than those of WT controls (filled bars). Shown are average weights (± SEM) of one epididymal fat pad from each mouse [for the standard diet, n = 5 for both genotypes (t test: P = 0.17); for the high-fat diet, n = 5 _Noc_−/− and n = 4 WT (t test: P = 0.024)].
Fig. 2.
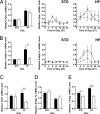
Lipid-related genes have diet- and genotype-dependent expression profiles. _Ppar_γ (A), Srebp-1c (B), Scd1 (C), Srebp-1a (D), and L-Fabp (E) mRNA levels were measured by using quantitative RT-PCR on total RNA isolated from livers from WT (filled bars and symbols) and _Noc_−/− (open bars and symbols) mice maintained on either a standard diet (STD) or a high-fat diet (HF). Samples were collected at 4-h intervals over 24 h from mice in a 12-h LD cycle. (A Left and B Left) Data pooled from all time points. (A Center and Right and B Center and Right) Data shown with respect to time of day (ZT0 is time of light onset, and ZT12 is light offset; ZT0 points are replotted as ZT24 to aid in visualization of the rhythm). There is a significant time of day effect for _Ppar_γ in the WT mice (repeated-measures ANOVA: P = 0.022) but not for the _Noc_−/− mice (P = 0.95) on the high-fat diet. The time-of-day effect for Srebp-1c is not significant for either genotype (P = 0.38, WT; P = 0.65, _Noc_−/−) on the high-fat diet, although on this diet the WT have significantly higher levels of Srebp-1c than the _Noc_−/− mice (P = 0.026) (n = 2–3 mice per time point per genotype). (C–E) Only pooled data (n = 15–18 mice per genotype) from all time points are shown because these mRNAs are not rhythmic. Shown are group means ± SEM. Asterisks denote statistically significant differences between genotypes (differences between diets are not marked): ∗, P < 0.05; ∗∗, P < 0.01; ∗∗∗, P < 0.001.
Fig. 3.
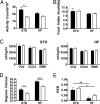
The lean phenotype is not due to hyperactivity or reduced caloric intake in the _Noc_−/− mice. (A) _Noc_−/− (open bars) are less active than WT (filled bars) mice on a standard diet (STD), but on a high-fat diet (HF) activity measurements are similar. Mice were fed ad libitum (n = 4 per group), and total activity was measured as infrared beam crossings in an Oxymax metabolic chamber system (Columbus Instruments). Values are group means ± SEM [t test: standard diet, P = 0.013; high-fat diet, not significant (P = 0.088)]. (B) There is no difference in caloric intake between _Noc_−/− (open bars) and WT (filled bars) mice on either standard or high-fat diets. The same adult male mice shown in A were analyzed for total caloric intake in the Oxymax metabolic chambers. All values represent group means ± SEM. No significant difference was determined by t test (P = 0.93 for both diets). (C) There are no significant differences in metabolic parameters between _Noc_−/− (open bars) and WT (filled bars) adult male mice. Mice were provided ad libitum access to either standard (Left) or high-fat (Right) chow in the Oxymax metabolic chamber system. Oxygen consumption and CO2 production were measured, and resting metabolic rate (RMR) was calculated (see Materials and Methods). Values are group means ± SEM (n = 4). There was no statistical difference between groups (t test: P > 0.45). (D) Body temperature was decreased in _Noc_−/− mice. Six mice of each genotype were maintained on a standard diet, and temperatures were recorded throughout a 21-day period using telemetry. The mice were then switched to high-fat diets, and body temperature data were collected for an additional 21 days. Body temperature means over the 21 days were calculated for each animal. Shown are group means ± SEM [asterisks denote statistically significant differences (t tests) between groups: ∗, P < 0.05 for standard diet; ∗∗∗, P < 0.001 for high-fat diet]. (E) Respiratory exchange rates were calculated by taking the ratio of VCO2/VO2 for each animal from C. The decreased value of the respiratory exchange rate on the high-fat diet is a reflection of the increased use of lipids as an energy source in both genotypes (asterisks denote statistically significant differences between groups: ∗, P < 0.05; ∗∗, P < 0.005). The difference between genotypes is not statistically significant on either diet (standard diet, P = 0.52, high-fat diet, P = 0.24), although on the high-fat diet the _Noc_−/− mice have a trend toward lower lipid utilization than the WT mice.
Fig. 4.
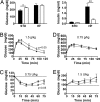
_Noc_−/− mice have diet-dependent changes in glucose and insulin tolerance. (A) Circulating glucose (Left) and insulin (Right) levels in _Noc_−/− (open bars) and WT (filled bars) mice on standard (STD) and high-fat (HF) diets were measured from blood at ZT5 after a 5-h fast. Shown are mean levels (± SEM) from five animals from each genotype. On the standard diet, the _Noc_−/− mice had slightly increased glucose levels over the WT mice (t test, P = 0.048) but had no difference on the high-fat diet (t test, P = 0.88). The insulin levels on the standard diet were not significantly different between genotypes (t test, P = 0.22) but were significantly decreased in the _Noc_−/− mice as compared with the WT mice on the high-fat diet (t test, P < 0.005). (B) Glucose tolerance tests performed on fasted (16 h) WT (filled symbols) and _Noc_−/− (open symbols) male mice at ZT4 revealed impaired glucose tolerance in _Noc_−/− mice on a standard diet. Mice were injected i.p. with
d
-glucose (1.5 g/kg of body weight; Sigma), and blood glucose values were measured at 0, 10, 20, 30, 60, 90, and 120 min after glucose injection (n = 12; repeated-measures two-way ANOVA, P = 0.041). Values are group means ± SEM. (C) Insulin tolerance tests on ad libitum-fed WT (filled symbols) and _Noc_−/− (open symbols) male mice at ZT8 revealed greater insulin sensitivity in _Noc_−/− mice on a standard diet. Blood glucose values were assayed immediately before and at 15, 30, 60, and 75 min after i.p. injection of mammalian crystalline insulin (0.75 units/kg of body weight; Lilly) (n = 18 WT and n = 17 knockout; repeated measures two-way ANOVA, P = 0.029). Values are group means ± SEM. (D) Both _Noc_−/− and WT mice exhibit glucose intolerance when fed a high-fat diet. Glucose tolerance tests were performed as in B except that the glucose dose was decreased by half to 0.75 g/kg. Values are group means ± SEM. There was no significant difference between genotypes (repeated-measures two-way ANOVA, P = 0.055). (E) Insulin tolerance tests conducted exactly as in C except with a 2-fold-higher insulin dose (1.5 units/kg of body weight) revealed that both WT (filled symbols) and _Noc_−/− (open symbols) mice become insulin-resistant when maintained on a high-fat diet for 3–4 months. Values are group means ± SEM (n = 14 per group). Significant differences between genotypes were not detected by using repeated-measures ANOVA (P = 0.80). Similar results were obtained with the standard 0.75 units/kg insulin dosage (data not shown).
Comment in
- Lean gene and the clock machine.
Ramsey KM, Bass J. Ramsey KM, et al. Proc Natl Acad Sci U S A. 2007 Jun 5;104(23):9553-4. doi: 10.1073/pnas.0703516104. Epub 2007 May 29. Proc Natl Acad Sci U S A. 2007. PMID: 17535891 Free PMC article. No abstract available.
Similar articles
- Lean gene and the clock machine.
Ramsey KM, Bass J. Ramsey KM, et al. Proc Natl Acad Sci U S A. 2007 Jun 5;104(23):9553-4. doi: 10.1073/pnas.0703516104. Epub 2007 May 29. Proc Natl Acad Sci U S A. 2007. PMID: 17535891 Free PMC article. No abstract available. - NOC out the fat: a short review of the circadian deadenylase Nocturnin.
Douris N, Green CB. Douris N, et al. Ann Med. 2008;40(8):622-6. doi: 10.1080/07853890802084878. Ann Med. 2008. PMID: 18608124 Review. - Posttranscriptional regulation of mammalian circadian clock output.
Garbarino-Pico E, Green CB. Garbarino-Pico E, et al. Cold Spring Harb Symp Quant Biol. 2007;72:145-56. doi: 10.1101/sqb.2007.72.022. Cold Spring Harb Symp Quant Biol. 2007. PMID: 18419272 Review. - Nocturnin: at the crossroads of clocks and metabolism.
Stubblefield JJ, Terrien J, Green CB. Stubblefield JJ, et al. Trends Endocrinol Metab. 2012 Jul;23(7):326-33. doi: 10.1016/j.tem.2012.03.007. Epub 2012 May 17. Trends Endocrinol Metab. 2012. PMID: 22608110 Free PMC article. Review. - Nocturnin regulates circadian trafficking of dietary lipid in intestinal enterocytes.
Douris N, Kojima S, Pan X, Lerch-Gaggl AF, Duong SQ, Hussain MM, Green CB. Douris N, et al. Curr Biol. 2011 Aug 23;21(16):1347-55. doi: 10.1016/j.cub.2011.07.018. Epub 2011 Aug 4. Curr Biol. 2011. PMID: 21820310 Free PMC article.
Cited by
- Genomic Insights into Pig Domestication and Adaptation: An Integrated Approach Using Genome-Wide Selection Analysis and Multiple Public Datasets.
Zhang H, Ruan P, Cong H, Xu L, Yang B, Ren T, Zhang D, Chen H, Hu P, Wang Z, Pan H, Yang X, Han Y, Zeng Y, Zhao Y, Liu D, Ceccobelli S, E G. Zhang H, et al. Animals (Basel). 2024 Nov 4;14(21):3159. doi: 10.3390/ani14213159. Animals (Basel). 2024. PMID: 39518882 Free PMC article. - The Roles of White Adipose Tissue and Liver NADPH in Dietary Restriction-Induced Longevity.
Jamerson LE, Bradshaw PC. Jamerson LE, et al. Antioxidants (Basel). 2024 Jul 8;13(7):820. doi: 10.3390/antiox13070820. Antioxidants (Basel). 2024. PMID: 39061889 Free PMC article. Review. - Homeostatic regulation of NAD(H) and NADP(H) in cells.
Chen L, Xing X, Zhang P, Chen L, Pei H. Chen L, et al. Genes Dis. 2023 Oct 17;11(5):101146. doi: 10.1016/j.gendis.2023.101146. eCollection 2024 Sep. Genes Dis. 2023. PMID: 38988322 Free PMC article. Review. - Circadian dysfunction and cardio-metabolic disorders in humans.
Marhefkova N, Sládek M, Sumová A, Dubsky M. Marhefkova N, et al. Front Endocrinol (Lausanne). 2024 Apr 29;15:1328139. doi: 10.3389/fendo.2024.1328139. eCollection 2024. Front Endocrinol (Lausanne). 2024. PMID: 38742195 Free PMC article. Review. - Gene Characterization of Nocturnin Paralogues in Goldfish: Full Coding Sequences, Structure, Phylogeny and Tissue Expression.
Madera D, Alonso-Gómez A, Delgado MJ, Valenciano AI, Alonso-Gómez ÁL. Madera D, et al. Int J Mol Sci. 2023 Dec 19;25(1):54. doi: 10.3390/ijms25010054. Int J Mol Sci. 2023. PMID: 38203224 Free PMC article.
References
- Reppert SM, Weaver DR. Nature. 2002;418:935–941. - PubMed
- Hastings MH, Reddy AB, Maywood ES. Nat Rev Neurosci. 2003;4:649–661. - PubMed
- Fu L, Lee CC. Nat Rev Cancer. 2003;3:350–361. - PubMed
Publication types
MeSH terms
Substances
Grants and funding
- EY02414/EY/NEI NIH HHS/United States
- EY11489/EY/NEI NIH HHS/United States
- R01 GM076626/GM/NIGMS NIH HHS/United States
- T32 GM008136/GM/NIGMS NIH HHS/United States
- DK063609/DK/NIDDK NIH HHS/United States
- GM076626/GM/NIGMS NIH HHS/United States
- 2T32 GM008136-21/GM/NIGMS NIH HHS/United States
- P30 DK063609/DK/NIDDK NIH HHS/United States
- R01 EY011489/EY/NEI NIH HHS/United States
- R01 EY002414/EY/NEI NIH HHS/United States
LinkOut - more resources
Full Text Sources
Other Literature Sources
Medical
Molecular Biology Databases
Research Materials


