GSMN-TB: a web-based genome-scale network model of Mycobacterium tuberculosis metabolism - PubMed (original) (raw)
GSMN-TB: a web-based genome-scale network model of Mycobacterium tuberculosis metabolism
Dany J V Beste et al. Genome Biol. 2007.
Abstract
Background: An impediment to the rational development of novel drugs against tuberculosis (TB) is a general paucity of knowledge concerning the metabolism of Mycobacterium tuberculosis, particularly during infection. Constraint-based modeling provides a novel approach to investigating microbial metabolism but has not yet been applied to genome-scale modeling of M. tuberculosis.
Results: GSMN-TB, a genome-scale metabolic model of M. tuberculosis, was constructed, consisting of 849 unique reactions and 739 metabolites, and involving 726 genes. The model was calibrated by growing Mycobacterium bovis bacille Calmette Guérin in continuous culture and steady-state growth parameters were measured. Flux balance analysis was used to calculate substrate consumption rates, which were shown to correspond closely to experimentally determined values. Predictions of gene essentiality were also made by flux balance analysis simulation and were compared with global mutagenesis data for M. tuberculosis grown in vitro. A prediction accuracy of 78% was achieved. Known drug targets were predicted to be essential by the model. The model demonstrated a potential role for the enzyme isocitrate lyase during the slow growth of mycobacteria, and this hypothesis was experimentally verified. An interactive web-based version of the model is available.
Conclusion: The GSMN-TB model successfully simulated many of the growth properties of M. tuberculosis. The model provides a means to examine the metabolic flexibility of bacteria and predict the phenotype of mutants, and it highlights previously unexplored features of M. tuberculosis metabolism.
Figures
Figure 1
Comparison of predicted and measured glycerol uptake rates as a function of controlled growth rate. Triangles indicate experimentally measured glycerol uptake rates for three growth rates set by three different dilution rates in the chemostat model. The dashed line represents the linear function fitted to the experimental data. Diamonds and solid line represent predictions of the model if glycerol were the only carbon source. Circles and dotted line show predictions of the model when additional oleic acid (hydrolysis product of Tween 80) transport in the range of 0 to 0.04 mmol/g dry weight (DW) per hour was allowed.
Figure 2
Comparison of gene essentiality predictions with TraSH data for in vitro growth on Middlebrook 7H10 medium. (a) Dependence of prediction results on the model and experimental thresholds for declaring gene essentiality. The plot shows receiver operating characteristic (ROC) curves for different transposon site hybridization (TraSH) ratio thresholds for determination of essential genes in experimental data. Each ROC curve shows 100 points corresponding to sensitivity and specificity of the model predictions obtained for growth rate thresholds varying in the range from 0.0 to 0.1 (increment 0.001). The growth rate threshold has little effect on prediction parameters. For values greater than 0.052 all genes were declared essential. Any threshold in the range from 0.001 to 0.041 resulted in exactly the same gene essentiality predictions. The ROC curve closest to the best theoretically possible prediction (sensitivity and specificity equal to 1) was obtained for a TraSH ratio threshold of 0.1. (b) Distributions of the hybridization ratio of the TraSH library to genomic DNA signal recorded in TraSH experiment for genes present in the model. Blue line shows distribution of the TraSH ratio among the genes that were predicted by the model to be essential for growth. Red line shows distribution of TraSH ratio among genes predicted to be nonessential for growth. Medians of the two distributions are significantly different by means of the Mann-Whitney test (P < 2 × 10-16). Thus, the genes that are predicted to be essential have significantly lower median value of insertion probe to genomic probe ratio than genes predicted to be nonessential. This is in accordance with experimental data, because the low ratio indicates that inactivation of the target gene by transposon insert results in depletion of the mutant strain after the growth on Middlebrook 7H10 medium.
Figure 3
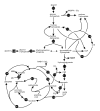
Predicted response of the Mycobacerium tuberculosis to slower growth rate induced by carbon limitation. Only selected central metabolic pathways are illustrated. The slower growth rate was simulated by adjusting glycerol uptake rates to obtain a predicted growth rate of 0.03 (fast growth rate corresponding to doubling time of 23 hours) and 0.01 (slow growth rate corresponding to doubling time of 69 hours). Arrows indicate biochemical reactions or pathways, and the number on the arrow indicates the response of the genome-scale metabolic network of M. tuberculosis (GSMN-TB) to slower growth rate. The numbers were calculated by flux variability analysis (FVA) as the ratios of midpoints of flux ranges obtained for slow and fast growth rates. The values have been normalized to account for the lower absolute carbon flux values at the slower growth rate, except for the glycerol uptake rate, which is not normalized to emphasize the fact that the growth rate was reduced by limiting glycerol. The direction of the arrows indicates the direct of flux, not reaction reversibility. CoA, coenzyme A; E4P, D-erythrose-4-phosphate; MK, menaquinone; MKH, menaquinol; S7P, D-sedoheptulose-7-phosphate.
Figure 4
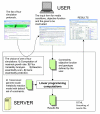
Overview of interactive resource workflow of GSMN-TB. The user chooses one of four analysis protocols (computation of maximal growth rate, flux variability analysis [FVA], reaction essentiality scan, or single gene essentiality prediction). Depending on the choice, an appropriate input form is presented. The server runs linear programming using the genome scale metabolic reaction network of Mycobacterium tuberculosis. Constraints defined by the user overwrite the default set of constraints specified in the model file. Numerical results are formatted as HTML and sent to the user's browser. GSMN-TB, genome-scale metabolic network of M. tuberculosis.
Figure 5
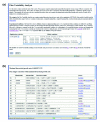
Screenshots illustrating FVA of M. tuberculosis using GSMN-TB. (a) Simulation set up. User specifies media conditions by setting minimal and maximal capacities of transport reactions in the 'Media conditions' field. The field contains specification of minimal glucose media and lists transport reactions that can be included by removing comment character. The page contains the link to the full model file, and the user may identify other reactions to be constrained. This adds additional flexibility to the simulation set up. The user may also choose one of the two objective functions used in our model to simulate in vitro or in vivo growth requirements. (b) Result of flux variability analysis (FVA) simulation. Maximal theoretical growth rate is displayed at the top of the page. Each row in the table contains reaction name maximal and minimal flux consistent with the maximal theoretical growth rate, reaction formula, and gene annotation. Gene names are linked to genome annotation pages of the TubercuList database. The rows of the table are loaded as computation progresses. The time of the simulation is about 10 min. GSMN-TB, genome-scale metabolic network of M. tuberculosis.
Similar articles
- Systems-based approaches to probing metabolic variation within the Mycobacterium tuberculosis complex.
Lofthouse EK, Wheeler PR, Beste DJ, Khatri BL, Wu H, Mendum TA, Kierzek AM, McFadden J. Lofthouse EK, et al. PLoS One. 2013 Sep 17;8(9):e75913. doi: 10.1371/journal.pone.0075913. eCollection 2013. PLoS One. 2013. PMID: 24098743 Free PMC article. - Development and analysis of an in vivo-compatible metabolic network of Mycobacterium tuberculosis.
Fang X, Wallqvist A, Reifman J. Fang X, et al. BMC Syst Biol. 2010 Nov 23;4:160. doi: 10.1186/1752-0509-4-160. BMC Syst Biol. 2010. PMID: 21092312 Free PMC article. - Interpreting expression data with metabolic flux models: predicting Mycobacterium tuberculosis mycolic acid production.
Colijn C, Brandes A, Zucker J, Lun DS, Weiner B, Farhat MR, Cheng TY, Moody DB, Murray M, Galagan JE. Colijn C, et al. PLoS Comput Biol. 2009 Aug;5(8):e1000489. doi: 10.1371/journal.pcbi.1000489. Epub 2009 Aug 28. PLoS Comput Biol. 2009. PMID: 19714220 Free PMC article. - Systems-level modeling of mycobacterial metabolism for the identification of new (multi-)drug targets.
Rienksma RA, Suarez-Diez M, Spina L, Schaap PJ, Martins dos Santos VA. Rienksma RA, et al. Semin Immunol. 2014 Dec;26(6):610-22. doi: 10.1016/j.smim.2014.09.013. Epub 2014 Oct 23. Semin Immunol. 2014. PMID: 25453232 Review. - Recent advances in inhibitor development and metabolic targeting in tuberculosis therapy.
Patel RR, Vidyasagar, Singh SK, Singh M. Patel RR, et al. Microb Pathog. 2025 Jun;203:107515. doi: 10.1016/j.micpath.2025.107515. Epub 2025 Mar 26. Microb Pathog. 2025. PMID: 40154850 Review.
Cited by
- Flux Balance Analysis with Objective Function Defined by Proteomics Data-Metabolism of Mycobacterium tuberculosis Exposed to Mefloquine.
Montezano D, Meek L, Gupta R, Bermudez LE, Bermudez JC. Montezano D, et al. PLoS One. 2015 Jul 28;10(7):e0134014. doi: 10.1371/journal.pone.0134014. eCollection 2015. PLoS One. 2015. PMID: 26218987 Free PMC article. - Mycobacterium tuberculosis Metabolism.
Mashabela GT, de Wet TJ, Warner DF. Mashabela GT, et al. Microbiol Spectr. 2019 Jul;7(4):10.1128/microbiolspec.gpp3-0067-2019. doi: 10.1128/microbiolspec.GPP3-0067-2019. Microbiol Spectr. 2019. PMID: 31350832 Free PMC article. Review. - The Mycobacterium tuberculosis drugome and its polypharmacological implications.
Kinnings SL, Xie L, Fung KH, Jackson RM, Xie L, Bourne PE. Kinnings SL, et al. PLoS Comput Biol. 2010 Nov 4;6(11):e1000976. doi: 10.1371/journal.pcbi.1000976. PLoS Comput Biol. 2010. PMID: 21079673 Free PMC article. - Towards a point-of-care test for active tuberculosis: obstacles and opportunities.
McNerney R, Daley P. McNerney R, et al. Nat Rev Microbiol. 2011 Mar;9(3):204-13. doi: 10.1038/nrmicro2521. Nat Rev Microbiol. 2011. PMID: 21326275 Review. - Systems level mapping of metabolic complexity in Mycobacterium tuberculosis to identify high-value drug targets.
Vashisht R, Bhat AG, Kushwaha S, Bhardwaj A; OSDD Consortium; Brahmachari SK. Vashisht R, et al. J Transl Med. 2014 Oct 11;12:263. doi: 10.1186/s12967-014-0263-5. J Transl Med. 2014. PMID: 25304862 Free PMC article.
References
- McKinney JD, Honer zu Bentrup K, Munoz-Elias EJ, Miczak A, Chen B, Chan WT, Swenson D, Sacchettini JC, Jacobs WR, Jr, Russell DG. Persistance of Mycobacterium tuberculosis in macrophages and mice requires the glyoxylate shunt enzyme isocitrate lyase. Nature. 2000;406:735–738. doi: 10.1038/35021074. - DOI - PubMed
Publication types
MeSH terms
LinkOut - more resources
Full Text Sources
Other Literature Sources


