A mouse model of tuberous sclerosis: neuronal loss of Tsc1 causes dysplastic and ectopic neurons, reduced myelination, seizure activity, and limited survival - PubMed (original) (raw)
Comparative Study
A mouse model of tuberous sclerosis: neuronal loss of Tsc1 causes dysplastic and ectopic neurons, reduced myelination, seizure activity, and limited survival
Lynsey Meikle et al. J Neurosci. 2007.
Abstract
Tuberous sclerosis (TSC) is a hamartoma syndrome caused by mutations in TSC1 or TSC2 in which cerebral cortical tubers and seizures are major clinical issues. We have engineered mice in which most cortical neurons lose Tsc1 expression during embryonic development. These Tsc1 mutant mice display several neurological abnormalities beginning at postnatal day 5 with subsequent failure to thrive and median survival of 35 d. The mice also display clinical and electrographic seizures both spontaneously and with physical stimulation, and some seizures end in a fatal tonic phase. Many cortical and hippocampal neurons are enlarged and/or dysplastic in the Tsc1 mutant mice, strongly express phospho-S6, and are ectopic in multiple sites in the cortex and hippocampus. There is a striking delay in myelination in the mutant mice, which appears to be caused by an inductive neuronal defect. This new TSC brain model replicates several features of human TSC brain lesions and implicates an important function of Tsc1/Tsc2 in neuronal development.
Figures
Figure 1.
Tsc1c−SynICre + survival, weight gain, phenotype, and EEG. A, Cumulative survival curve for Tsc1c−SynICre + (filled squares) and control (open squares) mice. B, Weight gain of Tsc1c−SynICre + (filled squares) and control (open squares) mice. C, Photograph of P21 Tsc1c−SynICre + mouse demonstrates hunched back, Straub tail, and out-turned paws. D, EEG segments (10 s) showing normal continuous control mouse background (I), a spike burst occurring in a somewhat irregular background in a mutant mouse (II), relative high-frequency desynchronization during a tonic seizure in a Tsc1c−SynICre + mouse (III), and frequent high-amplitude sharp waves in a mutant mouse (IV).
Figure 2.
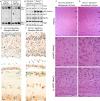
Loss of Tsc1 and brain structural abnormalities in the Tsc1c−SynICre+ mice. A, Southern blot analysis demonstrating recombination in brain DNA samples from Tsc1c−SynICre + compared with Tsc1c−SynICre− mice. The 4.2 kb (c allele) and 2.4 kb (− allele) bands are of equal intensity in the Tsc1c−SynICre− samples, whereas there is a marked shift from the 4.2 kb to the 2.4 kb band in the Tsc1c−SynICre + samples from cortex (Cor) and diencephalon (Dien) but not cerebellum (Cere). B, Immunoblot analysis showing reduction in expression of both tuberin (Tsc2) and hamartin (Tsc1), and elevated pS6 (S240–244) in the brains of Tsc1c−SynICre + mice. AKT is a loading control. NeuN and NSE blots show no difference between Tsc1c−SynICre + and control mice. C, D, Coronal sections from P21 Tsc1cwSynICre + (C) and Tsc1c−SynICre + (D) mice stained with H&E demonstrate an additional layer of cells at the base of the mutant cortex (asterisk) and widespread cell enlargement (Ca, Da). Cb, Cc, Db, Dc, Higher magnification of cortex layer V (Cb, Db) and layer VI (Cc, Dc) shows enlarged cells in both of these regions of Tsc1c−SynICre + brain. E, F, Combined X-gal–pS6 immunoperoxidase staining of coronal sections reveals widespread recombination in the form of X-gal product, which is blue in both Tsc1cwSynICre + (E) and Tsc1c−SynICre + mice (F). Ea, Fa, In contrast to control (Ea), in the Tsc1c−SynICre + brain (Fa), enlarged pS6+ cells (brown) in layer V, base of cortex (asterisk), and the stratum oriens (arrowheads) of the hippocampal CA1, associate with the X-gal blue precipitate. Eb, Fb, High-power view of stratum oriens shows a correlation between blue stain indicating cre expression, pS6 positivity, and cell enlargement in Tsc1c−SynICre + mice. Scale bars: Ca, Da, 50 μm; Cb, Cc, Db, Dc, 25 μm; Ea, Fa, 20 μm; Eb, Fb, 25 μm.
Figure 3.
Increased pS6 and widespread architectural abnormalities in P21 Tsc1c−SynICre + mice. A–F, In the RSG region of the motor cortex, there is increased pS6 expression in multiple cell layers, including a layer of pS6+ neurons at the base of the cortex in Tsc1c−SynICre + mice (D–F). G–L, In the somatosensory cortex, pS6+ neurons are prominent in cortical layer V and at the gray–white matter border at the base of the cortex in Tsc1c−SynICre + mice (J–L). Occasional large pS6+ neurons are seen in the CA1 pyramidal cell layer of the hippocampus but are also seen ectopically in the stratum oriens. M–R, In the hippocampal CA3 region, nearly all neurons are pS6+, including those outside the pyramidal cell layer in Tsc1c−SynICre + mice (P–R). S–X, In the dentate gyrus, there are occasional enlarged pS6+ cells in the granule cell layer in Tsc1c−SynICre + (V–X) mice. However, cells within the hilus are more severely affected, and ectopic pS6+ neurons are also apparent. Scale bars: A–F, 85 μm; G–X, 50 μm.
Figure 4.
Tsc1c−SynICre + interneurons are pS6+ and enlarged. A–F, Confocal images demonstrate that GAD67+ interneurons in P21 Tsc1c−SynICre + mice (D–F) are enlarged and pS6+ compared with control brain interneurons (A–C). Insets, Size comparison for single cells (arrowheads). In addition, some ectopic neurons in the white matter of Tsc1c−SynICre + brains are pS6+ GAD67+ interneurons (*). Scale bars, 20 μm.
Figure 5.
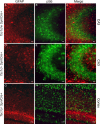
mTORC1 activation resulting from Tsc1 loss is restricted to neurons in Tsc1c−SynICre + mice. A–F, GFAP-positive astrocytes in the CA3 region of the hippocampus are distinct from pS6+ neurons in both P21 control (A–C) and Tsc1c−SynICre + (D–F) brains. D–I, The number and distribution of GFAP-positive cells in the Tsc1c−SynICre + hippocampus (D–F) and cortex (G–I) shows no evidence for astrogliosis in the mutant brain. Scale bars: A–F, 20 μm; G–I, 50 μm.
Figure 6.
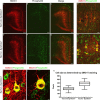
Enlarged, dysplastic pyramidal neurons in Tsc1c−SynICre + brains. A–C, E–G, In the RSG region of the motor cortex, the majority of pyramidal neurons identified by SMI 311 staining in layers V and III are strongly pS6+ in P21 Tsc1c−SynICre + (E–G) mice, in contrast to controls (A–C). E–G, Disruption of normal cortical lamination in Tsc1c−SynICre + mice is also evident, with enlarged SMI 311+/pS6+ cells outside layers III and V. H, Confocal images of layer V pyramidal neurons show enlarged dysplastic neurons with thickened dendritic arbors in Tsc1c−SynICre + mice (compare with D). I, J, Higher-power view of typical enlarged dysplastic SMI 311+/pS6+ neurons in cortical layer V (I) and in the granule cell layer of the dentate gyrus (J) in Tsc1c−SynICre + mice. K, Quantitative size analysis of SMI 311+ cells (_y_-axis, pixels) in layer V (−2 to −2.2 mm from bregma and 3.2–3.4 mm lateral to midline) shows increased soma size in Tsc1c−SynICre + mice when compared with controls (p = 0.0002). Scale bars: A–C, E–G, 100 μm; D, H, 25 μm; I, J, 10 μm.
Figure 7.
Hypomyelination in Tsc1c−SynICre + brains. A–F, Compared with controls (A–C), the RSG region of motor cortex of Tsc1c−SynICre + brains shows a marked reduction in MBP expression (D–F) in the corpus callosum, the pericallosal white matter, and radiating fibers extending into the cerebral cortex. Scale bars, 100 μm.
Figure 8.
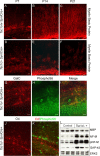
Developmental analysis of MBP expression, oligodendrocyte distribution and differential expression of neuronal proteins in Tsc1c−SynICre + mice. A–F, MBP expression (red) is reduced at P7, P14, and P21 in the external capsule of Tsc1c−SynICre + cortex (D–F) compared with controls (A–C). A persistent immature patchy pattern of MBP expression is seen throughout development in the mutant cortex. G–K, Premyelinating oligodendrocytes, as assessed by GalC (red; G, I) and O4 (red; J, K) staining, are present throughout the P7 Tsc1c−SynICre + brain but are pS6 negative (green; H, I, K). L, Immunoblot analysis of brain lysates shows that MBP levels are reduced in Tsc1c−SynICre + brains, whereas levels of nonphosphorylated and phosphorylated medium chain neurofilament and GAP-43 are increased, compared with controls. Scale bars: A–F, 50 μm; G–K, 20 μm.
Similar articles
- Single-cell Tsc1 knockout during corticogenesis generates tuber-like lesions and reduces seizure threshold in mice.
Feliciano DM, Su T, Lopez J, Platel JC, Bordey A. Feliciano DM, et al. J Clin Invest. 2011 Apr;121(4):1596-607. doi: 10.1172/JCI44909. Epub 2011 Mar 14. J Clin Invest. 2011. PMID: 21403402 Free PMC article. - Response of a neuronal model of tuberous sclerosis to mammalian target of rapamycin (mTOR) inhibitors: effects on mTORC1 and Akt signaling lead to improved survival and function.
Meikle L, Pollizzi K, Egnor A, Kramvis I, Lane H, Sahin M, Kwiatkowski DJ. Meikle L, et al. J Neurosci. 2008 May 21;28(21):5422-32. doi: 10.1523/JNEUROSCI.0955-08.2008. J Neurosci. 2008. PMID: 18495876 Free PMC article. - Cell-specific alterations of glutamate receptor expression in tuberous sclerosis complex cortical tubers.
Talos DM, Kwiatkowski DJ, Cordero K, Black PM, Jensen FE. Talos DM, et al. Ann Neurol. 2008 Apr;63(4):454-65. doi: 10.1002/ana.21342. Ann Neurol. 2008. PMID: 18350576 Free PMC article. - Tuberous sclerosis as an underlying basis for infantile spasm.
Yeung RS. Yeung RS. Int Rev Neurobiol. 2002;49:315-32. doi: 10.1016/s0074-7742(02)49019-8. Int Rev Neurobiol. 2002. PMID: 12040899 Review. - Tuberous sclerosis: a syndrome of incomplete tumor suppression.
McCall T, Chin SS, Salzman KL, Fults DW. McCall T, et al. Neurosurg Focus. 2006 Jan 15;20(1):E3. doi: 10.3171/foc.2006.20.1.4. Neurosurg Focus. 2006. PMID: 16459993 Review.
Cited by
- Somatostatin interneuron fate-mapping and structure in a Pten knockout model of epilepsy.
Drake AW, Jerow LG, Ruksenas JV, McCoy C, Danzer SC. Drake AW, et al. Front Cell Neurosci. 2024 Oct 21;18:1474613. doi: 10.3389/fncel.2024.1474613. eCollection 2024. Front Cell Neurosci. 2024. PMID: 39497922 Free PMC article. - Fetal brain mTOR signaling activation in tuberous sclerosis complex.
Tsai V, Parker WE, Orlova KA, Baybis M, Chi AW, Berg BD, Birnbaum JF, Estevez J, Okochi K, Sarnat HB, Flores-Sarnat L, Aronica E, Crino PB. Tsai V, et al. Cereb Cortex. 2014 Feb;24(2):315-27. doi: 10.1093/cercor/bhs310. Epub 2012 Oct 18. Cereb Cortex. 2014. PMID: 23081885 Free PMC article. - Timing of mTOR activation affects tuberous sclerosis complex neuropathology in mouse models.
Magri L, Cominelli M, Cambiaghi M, Cursi M, Leocani L, Minicucci F, Poliani PL, Galli R. Magri L, et al. Dis Model Mech. 2013 Sep;6(5):1185-97. doi: 10.1242/dmm.012096. Epub 2013 Jun 5. Dis Model Mech. 2013. PMID: 23744272 Free PMC article. - Plasticity and mTOR: towards restoration of impaired synaptic plasticity in mTOR-related neurogenetic disorders.
Gipson TT, Johnston MV. Gipson TT, et al. Neural Plast. 2012;2012:486402. doi: 10.1155/2012/486402. Epub 2012 Apr 30. Neural Plast. 2012. PMID: 22619737 Free PMC article. Review. - Research models of neurodevelopmental disorders: The right model in the right place.
Damianidou E, Mouratidou L, Kyrousi C. Damianidou E, et al. Front Neurosci. 2022 Oct 20;16:1031075. doi: 10.3389/fnins.2022.1031075. eCollection 2022. Front Neurosci. 2022. PMID: 36340790 Free PMC article. Review.
References
- Arseni C, Alexianu M, Horvat L, Alexianu D, Petrovici A. Fine structure of atypical cells in tuberous sclerosis. Acta Neuropathol (Berl) 1972;21:185–193. - PubMed
- Astrinidis A, Henske EP. Tuberous sclerosis complex: linking growth energy signaling pathways with human disease. Oncogene. 2005;24:7475–7481. - PubMed
- Astrinidis A, Cash TP, Hunter DS, Walker CL, Chernoff J, Henske EP. Tuberin, the tuberous sclerosis complex 2 tumor suppressor gene product, regulates Rho activation, cell adhesion and migration. Oncogene. 2002;21:8470–8476. - PubMed
- Baybis M, Yu J, Lee A, Golden JA, Weiner H, McKhann G, Aronica E, Crino PB. mTOR cascade activation distinguishes tubers from focal cortical dysplasia. Ann Neurol. 2004;56:478–487. - PubMed
Publication types
MeSH terms
Substances
Grants and funding
- DP1 OD003347/OD/NIH HHS/United States
- NS31718/NS/NINDS NIH HHS/United States
- R56 NS031718/NS/NINDS NIH HHS/United States
- R01 NS031718/NS/NINDS NIH HHS/United States
- P01 NS024279/NS/NINDS NIH HHS/United States
- NS24279/NS/NINDS NIH HHS/United States
LinkOut - more resources
Full Text Sources
Other Literature Sources
Medical
Molecular Biology Databases


