An SNF2 protein associated with nuclear RNA silencing and the spread of a silencing signal between cells in Arabidopsis - PubMed (original) (raw)
An SNF2 protein associated with nuclear RNA silencing and the spread of a silencing signal between cells in Arabidopsis
Lisa M Smith et al. Plant Cell. 2007 May.
Abstract
The silencing phenotype in Arabidopsis thaliana lines with an inverted repeat transgene under the control of a phloem-specific promoter was manifested in regions around veins due to a mobile signal of silencing. Genetic analysis implicates RNA-DEPENDENT RNA POLYMERASE2 (RDR2) and an RNA polymerase IVa subunit gene (NRPD1a) in the signaling mechanism. We also identified an SNF2 domain-containing protein (CLASSY1) that acts together with RDR2 and NRPD1a in the spread of transgene silencing and in the production of endogenous 24-nucleotide short interfering RNAs (siRNAs). Cytochemical analysis indicates that CLASSY1 may act in the nucleus with NRPD1a and RDR2 in the upstream part of RNA silencing pathways that generate a double-stranded RNA substrate for Dicer-like (DCL) nucleases. DCL3 and ARGONAUTE4 act in a downstream part of the pathway, leading to endogenous 24-nucleotide siRNA production, but are not required for intercellular signaling. From genetic analysis, we conclude that another downstream part of the pathway associated with intercellular signaling requires DCL4 and at least one other protein required for 21-nucleotide trans-acting siRNAs. We interpret the effect of polymerase IVa and trans-acting siRNA pathway mutations in terms of a modular property of RNA silencing pathways.
Figures
Figure 1.
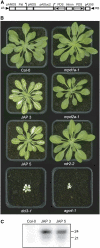
A Transgenic Experimental System for the Analysis of Silencing Signal Spreading. (A) T-DNA of the PSuc2:PDS construct. LB and RB indicate the left and right T-DNA borders, respectively. Arrows indicate the directions of transcription from the promoters and transcriptional start sites. pNOS, pANOS, and pA35S indicate the nopaline synthase promoter and terminator and the cauliflower mosaic virus 35S terminator, respectively. The intron is At WRKY33 intron 1. Pat indicates the phosphinothricin-_N_-acetyltransferase gene, which gives resistance to
dl
-phosphinothricin. The pJawohl 8 backbone surrounding the T-DNA is not shown. (B) Phenotypes of the two PSuc2:PDS lines (JAP 3 and JAP 5) used in this study compared with the parental Columbia-0 (Col-0) line. Also shown are the phenotypes of the PSuc2:PDS (JAP 3) line in the ago4-1, dcl3-1, nrpd1a-1, nrpd2a-1, and rdr2-2 backgrounds. All plants except for wild-type Col-0 are homozygous for the PSuc2:PDS construct. Plants were grown in controlled-environment rooms with an 8-h photoperiod. (C) Detection of PDS siRNAs in Col-0 and the PSuc2:PDS lines (JAP 3 and JAP 5). Low molecular weight RNA gel blot analysis was performed on 50 μg of total nucleic acids isolated from the aerial portions of 1-month-old plants. The probe was a 32P-labeled PDS transcript.
Figure 2.
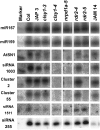
Detection of Endogenous siRNAs and miRNAs in the Spread of Silencing Mutants. Low molecular weight RNA gel blot analysis was performed on 20 μg of total nucleic acids isolated from young inflorescence tissue. Each plant line is indicated above the lane. The probes were hybridized to the same blot that was stripped and reprobed. Analysis is shown here for two clsy1 mutants, the two new rdr2 alleles, a representative nrpd1a mutant, and JAM 14 as a representative of the mutants in the tasiRNA synthesis pathway; full analysis of all mutant lines is given in Supplemental Figure 2 online. siRNA1511 is derived from TAS2, and siRNA255 is derived from the three TAS1 loci.
Figure 3.
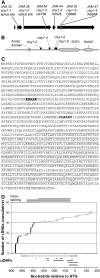
Structures of the Gene and the Encoded Protein for the SNF2 Domain–Containing Protein CLSY1. (A) Intron–exon structure of the coding region showing the mutations identified in the PSuc2:PDS screen. (B) Diagrammatic representation of the predicted 1256–amino acid CLSY1 protein indicating proposed structural domains and the effect of four mutations on the protein-coding region. The acidic domain is a region of 18 amino acids of which 15 are Glu or Asp. SNF2 is the area defined by pfam00176, and helicase C (HelicC) is the region defined by cd00079, as identified by National Center for Biotechnology Information conserved domains search. (C) Protein sequence of CLSY1 indicating the motifs discussed in the text. The nuclear localization signal and CLASSY sequence are indicated in boldface type, while the SNF2 and helicase C domains are underlined. (D) Structure of the CLSY1 5′ UTR. The graph indicates the relative transcriptional start site of 41 cDNAs sequenced relative to the translational start site (0). cDNAs indicated by black dots have an intron (−452 to −46 nucleotides) of the length indicated by the black line above the graph spliced out of the RNA. The one cDNA with an intron from −461 to −46 nucleotides is indicated by a dark gray dot, with a dark gray line above representing the intronic region. cDNAs with a shorter intron (−343 to −46 nucleotides; dashed line) are represented by striped dots, while cDNAs with no introns removed are indicated by white dots. Upstream open reading frames (uORFs) coded within the 5′ UTR are shown by representative lines below the graph. See Supplemental Tables 2 and 3 online for further details.
Figure 4.
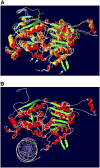
Model of the C-Terminal Section of CLSY1 Based on Similarity with Rad54. (A) The crystal structure of Rad54 (Thoma et al., 2005) is superimposed on the predicted structure for the C-terminal domain of CLSY1 as a SwissPDB image. Rad54 is shown in yellow (coils), orange (α-helices), and blue (β-sheets), while CLSY1 is indicated in white (coils), red (α-helices), and green (β-sheets). Variant loops in the DNA binding region are indicated by arrows, with the loop specified by the blue arrow specific to CLSY1 and CLSY2. (B) The predicted structure for CLSY1 is shown with DNA in the putative binding cleft. The side chains of some basic residues that may contribute to DNA binding are shown in a stick model.
Figure 5.
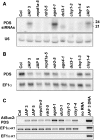
PDS and PSuc2:PDS RNAs in Wild-Type and Mutant Plants. (A) Detection of PDS siRNAs in mutant backgrounds. Low molecular weight RNA gel blot analysis was performed on 50 μg of total nucleic acids isolated from the aerial portions of 1-month-old plants. The PDS probe was prepared by T7 transcription from a T7:PDS template amplified from genomic DNA using primers T7 PDS 5′ and PDS 5862r. The U6 signal is included as a loading control. (B) PDS mRNA levels in 24-nucleotide siRNA pathway mutants. A total of 1.75 μg of poly(A) RNA from 1-month-old plants was analyzed by high molecular weight RNA gel blot. A randomly primed probe from a PDS PCR product (amplified using primers PDS left and PDS right) was used to detect PDS transcript. _EF1_α was probed as a loading control. (C) RT-PCRs prepared with the Qiagen one-step RT-PCR kit on total RNA from 1-month-old seedlings. The bottom panel shows a negative control of EF1α RT-PCRs in which the reverse transcription step was omitted from the protocol. Thirty-four cycles of amplification were used for the transgene, and 26 cycles of amplification were used for EF1α.
Figure 6.
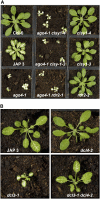
Phenotype Analysis of Double Mutants. (A) Photobleaching phenotypes of double mutants of the 24-nucleotide pathway. Parental lines are also shown as indicated. Plants were grown in controlled-environment rooms with an 8-h photoperiod. All plants except for wild-type Col-0 are homozygous for the PSuc2:PDS construct. (B) dcl3-1 dcl4-2 double and single mutants exhibiting intermediate photobleaching compared with the two single mutants. All plants are hemizygous for the PSuc2:PDS construct.
Figure 7.
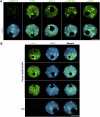
Subcellular Localization of CLSY1 Compared with 24-Nucleotide siRNA Pathway Proteins. (A) Immunolocalization of NRPD1a, RDR2, DCL3, NRPD1b, and DRD1 in nuclei of wild-type cells (green fluorescence). Counterstaining of nuclei with DAPI (blue fluorescence) reveals the nucleolus as a black hole. Neither NRPD1a nor DRD1 localizes within the nucleolus, but RDR2, DCL3, and NRPD1b all localize to a nucleolar dot at the edge of the nucleolus, corresponding to the apparent 24-nucleotide siRNA processing center, in addition to nucleoplasmic localization. RDR2 also forms a characteristic crescent (as shown) or a complete ring around the inner perimeter of the nucleolus. Bar = 5 μm. (B) Localization of CLSY1 by virtue of its HA epitope tag in clsy1 PCLSY1:3xHA-CLSY1 lines. Nuclei were counterstained with DAPI (blue). Typical localization patterns in independently transformed lines in the clsy1-3 and clsy1-4 mutant backgrounds are shown. No signal is detected in nontransgenic Col-0, as expected. Bar = 5 μm.
Figure 8.
Effect of the clsy1 Alleles on RDR2 and NRPD1a Localization. Immunolocalization using antibodies raised against the native RDR2 (A) and NRPD1a (B) is shown in green. Representative nuclei corresponding to RDR2 or NRPD1a interphase distribution patterns are presented. The frequency of nuclei observed in Arabidopsis Col-0 and in clsy1-3 and clsy1-4 mutants is shown (see also Supplemental Table 4 online). (A) Disruption of RDR2 localization. Localization patterns are classified as follows: type I, nucleoplasmic foci, nucleolar dot, and nucleolar perimeter ring; type II, nucleoplasmic foci and nucleolar dot, no nucleolar perimeter ring; type III, nucleoplasmic foci only (no nucleolar dot or ring). Bar = 5 μm. (B) clsy1 mutant alleles have subtle effects on NRPD1a localization. The interphase nuclei were sorted according to the localization patterns observed as follows: type I, large number of small foci in the nucleoplasm and near the chromocenter periphery; type II, one to three large foci or diffuse labeling with no detectable foci. Bar = 5 μm.
Figure 9.
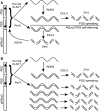
Model for RNA Silencing in the PSuc2:PDS Line. (A) In wild-type plants, we propose that two parallel pathways of PDS silencing and PSuc2:PDS self-silencing operate through amplification by Pol IVa/CLSY1/RDR2 and siRNA production by DCL4. By contrast, the PSuc2:PDS self-silencing pathway is proposed to function through Pol II, DCL3, and AGO4. (B) In the absence of DCL3 or AGO4, transcription of the inverted repeat by Pol II and Pol IVa may lead to the production of excess siRNAs through DCL4 and increased PDS silencing.
Similar articles
- Nuclear gene silencing directs reception of long-distance mRNA silencing in Arabidopsis.
Brosnan CA, Mitter N, Christie M, Smith NA, Waterhouse PM, Carroll BJ. Brosnan CA, et al. Proc Natl Acad Sci U S A. 2007 Sep 11;104(37):14741-6. doi: 10.1073/pnas.0706701104. Epub 2007 Sep 4. Proc Natl Acad Sci U S A. 2007. PMID: 17785412 Free PMC article. - Distinct and concurrent pathways of Pol II- and Pol IV-dependent siRNA biogenesis at a repetitive trans-silencer locus in Arabidopsis thaliana.
Sasaki T, Lee TF, Liao WW, Naumann U, Liao JL, Eun C, Huang YY, Fu JL, Chen PY, Meyers BC, Matzke AJ, Matzke M. Sasaki T, et al. Plant J. 2014 Jul;79(1):127-38. doi: 10.1111/tpj.12545. Epub 2014 Jun 13. Plant J. 2014. PMID: 24798377 - Transitivity in Arabidopsis can be primed, requires the redundant action of the antiviral Dicer-like 4 and Dicer-like 2, and is compromised by viral-encoded suppressor proteins.
Moissiard G, Parizotto EA, Himber C, Voinnet O. Moissiard G, et al. RNA. 2007 Aug;13(8):1268-78. doi: 10.1261/rna.541307. Epub 2007 Jun 25. RNA. 2007. PMID: 17592042 Free PMC article. - Cell biology of the Arabidopsis nuclear siRNA pathway for RNA-directed chromatin modification.
Pikaard CS. Pikaard CS. Cold Spring Harb Symp Quant Biol. 2006;71:473-80. doi: 10.1101/sqb.2006.71.046. Cold Spring Harb Symp Quant Biol. 2006. PMID: 17381329 Review. - The function of RNAi in plant development.
Poethig RS, Peragine A, Yoshikawa M, Hunter C, Willmann M, Wu G. Poethig RS, et al. Cold Spring Harb Symp Quant Biol. 2006;71:165-70. doi: 10.1101/sqb.2006.71.030. Cold Spring Harb Symp Quant Biol. 2006. PMID: 17381293 Review.
Cited by
- Mutations in the Arabidopsis H3K4me2/3 demethylase JMJ14 suppress posttranscriptional gene silencing by decreasing transgene transcription.
Le Masson I, Jauvion V, Bouteiller N, Rivard M, Elmayan T, Vaucheret H. Le Masson I, et al. Plant Cell. 2012 Sep;24(9):3603-12. doi: 10.1105/tpc.112.103119. Epub 2012 Sep 21. Plant Cell. 2012. PMID: 23001035 Free PMC article. - An endogenous, systemic RNAi pathway in plants.
Dunoyer P, Brosnan CA, Schott G, Wang Y, Jay F, Alioua A, Himber C, Voinnet O. Dunoyer P, et al. EMBO J. 2010 May 19;29(10):1699-712. doi: 10.1038/emboj.2010.65. Epub 2010 Apr 22. EMBO J. 2010. PMID: 20414198 Free PMC article. Retracted. - The de novo cytosine methyltransferase DRM2 requires intact UBA domains and a catalytically mutated paralog DRM3 during RNA-directed DNA methylation in Arabidopsis thaliana.
Henderson IR, Deleris A, Wong W, Zhong X, Chin HG, Horwitz GA, Kelly KA, Pradhan S, Jacobsen SE. Henderson IR, et al. PLoS Genet. 2010 Oct 28;6(10):e1001182. doi: 10.1371/journal.pgen.1001182. PLoS Genet. 2010. PMID: 21060858 Free PMC article. - Identification of miniature inverted-repeat transposable elements (MITEs) and biogenesis of their siRNAs in the Solanaceae: new functional implications for MITEs.
Kuang H, Padmanabhan C, Li F, Kamei A, Bhaskar PB, Ouyang S, Jiang J, Buell CR, Baker B. Kuang H, et al. Genome Res. 2009 Jan;19(1):42-56. doi: 10.1101/gr.078196.108. Epub 2008 Nov 26. Genome Res. 2009. PMID: 19037014 Free PMC article. - SRA-domain proteins required for DRM2-mediated de novo DNA methylation.
Johnson LM, Law JA, Khattar A, Henderson IR, Jacobsen SE. Johnson LM, et al. PLoS Genet. 2008 Nov;4(11):e1000280. doi: 10.1371/journal.pgen.1000280. Epub 2008 Nov 28. PLoS Genet. 2008. PMID: 19043555 Free PMC article.
References
- Allen, E., Xie, Z., Gustafson, A.M., and Carrington, J.C. (2005). MicroRNA-directed phasing during trans-acting siRNA biogenesis in plants. Cell 121 207–221. - PubMed
- Axtell, M.J., Jan, C., Rajagopalan, R., and Bartel, D.P. (2006). A two-hit trigger for siRNA biogenesis in plants. Cell 127 565–577. - PubMed
- Bates, P., Kelley, L., MacCallum, R., and Sternberg, M. (2001). Enhancement of protein modeling by human intervention in applying the automatic programs 3D-JIGSAW and 3D-PSSM. Proteins 45 39–46. - PubMed
- Baulcombe, D. (2004). RNA silencing in plants. Nature 431 356–363. - PubMed
- Bechtold, N., Ellis, J., and Pelletier, G. (1993). In planta Agrobacterium-mediated gene transfer by infiltration of adult Arabidopsis thaliana plants. C. R. Acad. Sci. III 316 1194–1199.
Publication types
MeSH terms
Substances
LinkOut - more resources
Full Text Sources
Other Literature Sources
Molecular Biology Databases
