Molecular concepts analysis links tumors, pathways, mechanisms, and drugs - PubMed (original) (raw)
Molecular concepts analysis links tumors, pathways, mechanisms, and drugs
Daniel R Rhodes et al. Neoplasia. 2007 May.
Abstract
Global molecular profiling of cancers has shown broad utility in delineating pathways and processes underlying disease, in predicting prognosis and response to therapy, and in suggesting novel treatments. To gain further insights from such data, we have integrated and analyzed a comprehensive collection of "molecular concepts" representing > 2500 cancer-related gene expression signatures from Oncomine and manual curation of the literature, drug treatment signatures from the Connectivity Map, target gene sets from genome-scale regulatory motif analyses, and reference gene sets from several gene and protein annotation databases. We computed pairwise association analysis on all 13,364 molecular concepts and identified > 290,000 significant associations, generating hypotheses that link cancer types and subtypes, pathways, mechanisms, and drugs. To navigate a network of associations, we developed an analysis platform, the Molecular Concepts Map. We demonstrate the utility of the approach by highlighting molecular concepts analyses of Myc pathway activation, breast cancer relapse, and retinoic acid treatment.
Figures
Figure 1
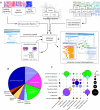
The MCM project. (A) Molecular concepts or biologically related gene sets were collected, standardized, and stored in the MCM database. Molecular concepts were derived from 503 independent microarray studies comprising > 20,000 microarray experiments, 3 promoter scanning and comparative genomics regulatory motif analyses, and 12 gene and protein annotation resources (Table 1). Molecular concepts were standardized to Entrez Gene identifiers. Each pair of molecular concepts was compared and assessed for significant association with Fisher's exact test. Pairs of concepts that exhibited statistically significant overlap (P < 1e − 6) were considered “linked.” A database-driven web application (
) was developed to analyze and visualize molecular concepts and concept links. The web application also serves as a portal for users to upload and analyze new concepts. (B) An overview of concept types represented in the analysis. Table 1 provides exact concept counts. (C) Pairwise association analysis of all molecular concepts identified 322,656 pairs of significantly linked concepts. The area of each circle is proportional to the number of significant associations between pairs of concept types.
Figure 2
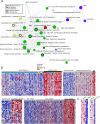
Molecular concepts analysis of the Myc pathway activation signature, consisting of the top 5% of genes most overexpressed in Myc transfection in human mammary epithelial cells [24]. (A) A molecular concepts map of the Myc signature (red node) and selected significantly linked concepts. Each node represents a molecular concept or a set of biologically related genes. The size of the node is proportional to the number of genes in the concept. The color of the concept indicates concept type (see legend). Each edge signifies a statistically significant association (P < 1e − 6). The drug signatures consist of genes downregulated by drug treatment in the specified cell line. HMECs = human mammary epithelial cells. Concept details are provided in Table W1. (B) Representative heatmaps depicting Myc pathway activation in Ig-Myc-positive lymphoma, metastatic prostate cancer, colorectal carcinoma, and grade III breast cancer. Each heatmap column is an individual tumor. Each row is a gene from the Myc activation signature. Red and blue indicate relative overexpression and underexpression, respectively. Ig-Myc = Myc translocation involving immunoglobulin locus; DLBCL = diffuse large B-cell lymphoma; B-UC = B-cell lymphoma unclassified; BL = Burkitt's lymphoma; Met = metastatic prostate cancer; BCa = breast carcinoma. (C) Representative heatmaps depicting Myc pathway repression by LY-294002 and wortmannin treatments.
Figure 3
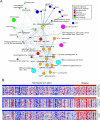
Molecular concepts analysis of an ER+ breast cancer relapse signature (MCM: 122567) consisting of the top 5% of genes most overexpressed in ER+ tumors from patients who relapsed within 5 years relative to those who did not. (A) A molecular concepts map of the ER+ relapse signature (yellow node) and selected significantly linked concepts. Each node represents a molecular concept or a set of biologically related genes. The size of the node is proportional to the number of genes in the concept. The color of the concept indicates concept type (see legend). Each edge signifies a statistically significant association (P < 1e − 6). The drug signatures consist of genes downregulated by drug treatment in the specified cell line. HMECs = human mammary epithelial cells. Concept details are provided in Table W2. (B) Representative heatmaps depicting the expression of cell cycle, serum response, and 17q25 concepts in the dataset from which the ER+ relapse signature was derived. Each heatmap column is an individual ER+ breast tumor. Each row is a gene from the ER+ relapse signature and denoted concepts. Red and blue indicate relative overexpression and underexpression, respectively.
Figure 4
Molecular concepts analysis of a retinoic acid signature, consisting of 454 genes repressed in APL cells treated with retinoic acid. (A) A molecular concepts map of the retinoic acid signature (yellow node) and selected significantly linked concepts. Each node represents a molecular concept or a set of biologically related genes. The size of the node is proportional to the number of genes in the concept. The color of the concept indicates concept type (see legend). Each edge signifies a statistically significant association (P < 1e − 6). The drug signatures consist of genes downregulated by drug treatment in the specified cell line. HMECs = human mammary epithelial cells; AML = acute myeloid leukemia; ALL = acute lymphoblastic leukemia. Concept details are provided in Table W4. (B) A heatmap depicting genes from the retinoic acid signature in an AML dataset from which an M3 (APL) signature was derived. Each heatmap column is an individual AML specimen. Each row is a gene from the retinoic acid signature. Red and blue indicate relative overexpression and underexpression, respectively.
Similar articles
- MSD-MAP: A Network-Based Systems Biology Platform for Predicting Disease-Metabolite Links.
Wathieu H, Issa NT, Mohandoss M, Byers SW, Dakshanamurthy S. Wathieu H, et al. Comb Chem High Throughput Screen. 2017;20(3):193-207. doi: 10.2174/1386207319666161214111254. Comb Chem High Throughput Screen. 2017. PMID: 28024464 - Identification of genes and pathways involved in kidney renal clear cell carcinoma.
Yang W, Yoshigoe K, Qin X, Liu JS, Yang JY, Niemierko A, Deng Y, Liu Y, Dunker A, Chen Z, Wang L, Xu D, Arabnia HR, Tong W, Yang M. Yang W, et al. BMC Bioinformatics. 2014;15 Suppl 17(Suppl 17):S2. doi: 10.1186/1471-2105-15-S17-S2. Epub 2014 Dec 16. BMC Bioinformatics. 2014. PMID: 25559354 Free PMC article. - Topological network analysis of differentially expressed genes in cancer cells with acquired gefitinib resistance.
Lee YS, Hwang SG, Kim JK, Park TH, Kim YR, Myeong HS, Kwon K, Jang CS, Noh YH, Kim SY. Lee YS, et al. Cancer Genomics Proteomics. 2015 May-Jun;12(3):153-66. Cancer Genomics Proteomics. 2015. PMID: 25977174 - Cancer network activity associated with therapeutic response and synergism.
Serra-Musach J, Mateo F, Capdevila-Busquets E, de Garibay GR, Zhang X, Guha R, Thomas CJ, Grueso J, Villanueva A, Jaeger S, Heyn H, Vizoso M, Pérez H, Cordero A, Gonzalez-Suarez E, Esteller M, Moreno-Bueno G, Tjärnberg A, Lázaro C, Serra V, Arribas J, Benson M, Gustafsson M, Ferrer M, Aloy P, Pujana MÀ. Serra-Musach J, et al. Genome Med. 2016 Aug 24;8(1):88. doi: 10.1186/s13073-016-0340-x. Genome Med. 2016. PMID: 27553366 Free PMC article. - Comparative analysis of protein interactome networks prioritizes candidate genes with cancer signatures.
Li Y, Sahni N, Yi S. Li Y, et al. Oncotarget. 2016 Nov 29;7(48):78841-78849. doi: 10.18632/oncotarget.12879. Oncotarget. 2016. PMID: 27791983 Free PMC article.
Cited by
- PanomiR: a systems biology framework for analysis of multi-pathway targeting by miRNAs.
Naderi Yeganeh P, Teo YY, Karagkouni D, Pita-Juárez Y, Morgan SL, Slack FJ, Vlachos IS, Hide WA. Naderi Yeganeh P, et al. Brief Bioinform. 2023 Sep 22;24(6):bbad418. doi: 10.1093/bib/bbad418. Brief Bioinform. 2023. PMID: 37985452 Free PMC article. - The War on Cancer rages on.
Rehemtulla A. Rehemtulla A. Neoplasia. 2009 Dec;11(12):1252-63. doi: 10.1593/neo.91866. Neoplasia. 2009. PMID: 20019833 Free PMC article. - Translocations in epithelial cancers.
Brenner JC, Chinnaiyan AM. Brenner JC, et al. Biochim Biophys Acta. 2009 Dec;1796(2):201-15. doi: 10.1016/j.bbcan.2009.04.005. Epub 2009 May 4. Biochim Biophys Acta. 2009. PMID: 19406209 Free PMC article. Review. - Estrogen receptor prevents p53-dependent apoptosis in breast cancer.
Bailey ST, Shin H, Westerling T, Liu XS, Brown M. Bailey ST, et al. Proc Natl Acad Sci U S A. 2012 Oct 30;109(44):18060-5. doi: 10.1073/pnas.1018858109. Epub 2012 Oct 17. Proc Natl Acad Sci U S A. 2012. PMID: 23077249 Free PMC article. - Network modeling identifies molecular functions targeted by miR-204 to suppress head and neck tumor metastasis.
Lee Y, Yang X, Huang Y, Fan H, Zhang Q, Wu Y, Li J, Hasina R, Cheng C, Lingen MW, Gerstein MB, Weichselbaum RR, Xing HR, Lussier YA. Lee Y, et al. PLoS Comput Biol. 2010 Apr 1;6(4):e1000730. doi: 10.1371/journal.pcbi.1000730. PLoS Comput Biol. 2010. PMID: 20369013 Free PMC article.
References
- Chang JC, Wooten EC, Tsimelzon A, Hilsenbeck SG, Gutierrez MC, Elledge R, Mohsin S, Osborne CK, Chamness GC, Allred DC, et al. Gene expression profiling for the prediction of therapeutic response to docetaxel in patients with breast cancer. Lancet. 2003;362:362–369. - PubMed
- Hess KR, Anderson K, Symmans WF, Valero V, Ibrahim N, Mejia JA, Booser D, Theriault RL, Buzdar AU, Dempsey PJ, et al. Pharmacogenomic predictor of sensitivity to preoperative chemotherapy with paclitaxel and fluorouracil, doxorubicin, and cyclophosphamide in breast cancer. J Clin Oncol. 2006;24:4236–4244. (Epub 2006 August 4238). - PubMed
- Potti A, Dressman HK, Bild A, Riedel RF, Chan G, Sayer R, Cragun J, Cottrill H, Kelley MJ, Petersen R, et al. Genomic signatures to guide the use of chemotherapeutics. Nat Med. 2006;12:1294–1300. (Epub 2006 October 1222). - PubMed
- Rosenwald A, Wright G, Chan WC, Connors JM, Campo E, Fisher RI, Gascoyne RD, Muller-Hermelink HK, Smeland EB, Giltnane JM. The use of molecular profiling to predict survival after chemotherapy for diffuse large-B-cell lymphoma. N Engl J Med. 2002;346:1937–1947. - PubMed
MeSH terms
Substances
Grants and funding
- P30 CA046592/CA/NCI NIH HHS/United States
- U54 DA021519/DA/NIDA NIH HHS/United States
- P50 CA069568/CA/NCI NIH HHS/United States
- U01 CA111275/CA/NCI NIH HHS/United States
- R01 CA097063/CA/NCI NIH HHS/United States
LinkOut - more resources
Full Text Sources
Other Literature Sources


