A combined approach to improving large-scale production of tobacco etch virus protease - PubMed (original) (raw)
A combined approach to improving large-scale production of tobacco etch virus protease
Paul G Blommel et al. Protein Expr Purif. 2007 Sep.
Abstract
Tobacco etch virus NIa proteinase (TEV protease) is an important tool for the removal of fusion tags from recombinant proteins. Production of TEV protease in Escherichia coli has been hampered by insolubility and addressed by many different strategies. However, the best previous results and newer approaches for protein expression have not been combined to test whether further improvements are possible. Here, we use a quantitative, high-throughput assay for TEV protease activity in cell lysates to evaluate the efficacy of combining several previous modifications with new expression hosts and induction methods. Small-scale screening, purification and mass spectral analysis showed that TEV protease with a C-terminal poly-Arg tag was proteolysed in the cell to remove four of the five arginine residues. The truncated form was active and soluble but in contrast, the tagged version was also active but considerably less soluble. An engineered TEV protease lacking the C-terminal residues 238-242 was then used for further expression optimization. From this work, expression of TEV protease at high levels and with high solubility was obtained by using auto-induction medium at 37 degrees C. In combination with the expression work, an automated two-step purification protocol was developed that yielded His-tagged TEV protease with >99% purity, high catalytic activity and purified yields of approximately 400 mg/L of expression culture (approximately 15 mg pure TEV protease per gram of E. coli cell paste). Methods for producing glutathione-S-transferase-tagged TEV with similar yields (approximately 12 mg pure protease fusion per gram of E. coli cell paste) are also reported.
Figures
Figure 1
Primers used for two-step PCR cloning of TEV protease. The first round of PCR amplification was used to generate DNA fragments at the 5′ end of the gene (A, 5′ fragments), the central portion of the gene (B, central fragments), and the 3′ end of the gene (C, 3′ fragments). The forward primers are shown above the TEV S219V nucleotide sequence and the reverse primers are shown below. Restriction sites are highlighted in blue (5′ SgfI and 3′ PmeI), codons containing solubility enhancing mutations in yellow, and stop codons in green. Overlap extension PCR of the entire coding region was completed by combining the 5′-, central, and 3′-fragments with the appropriate outside primers. The overlapping sequences between the fragments are underlined. The 5′-fragments determined the fusion tag context while 3′-fragments specified the location of the stop codon. For the GT clones, vectors were digested with PacI and PmeI since the PacI and SgfI cleavage sites contain compatible overhanging nucleotides. After ligation, neither restriction site was regenerated.
Figure 2
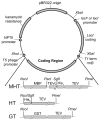
Maps of three expression vectors used in this work. The vectors are identical except for the coding region and the promoter used for expression of LacI. The MHT coding region produces MBP-His7-TEV with a TEV protease site (TEVc) between MBP and the His7 sequence. After cleavage at the TEVc site, the MHT coding region yields Ala-Ile-Ala-His7-TEV. The HT coding region yields His8-TEV. The GT coding region produces a non-cleavable GST-LeuIleAla-TEV protease fusion with no His-tag. Expression levels from auto-induction were increased by replacing the lacIq promoter with a wild type lacI promoter.
Figure 3
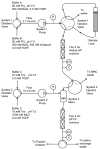
A schematic representation of the equipment used for automated two-step purification of His7-TEV protease. The solid lines in the system injection valves show the flow path during the simultaneous IMAC elution and cation exchange binding phase of the purification. The dotted lines indicate flow paths used during other phases of the purification. Separate control programs were developed for the IMAC and cation exchange steps and were synchronized by starting the programs at the same time. By specifying the timing of steps that require coordinated action of both units, no communication between the purification units was required. Abbreviations: P, pressure sensor; UV, absorbance detector making measurements at 280 nm; C, conductivity detector.
Figure 4
A representative fluorescence polarization assay of TEV protease activity present in an E. coli cell lysate. Open circles show anisotropy data for an E. coli lysate that did not contain TEV protease. Open triangles show results from expression of MHT238Δ. The gaps in the data occurred when the assay plate was removed from the instrument to add components for additional assays in other wells.
Figure 5
Cation exchange elution absorbance profiles for TEV protease produced from pQE30-S219V (upper trace) and pRK793 (lower trace). The concentration gradient is shown as a dashed line with the concentration indicated by the right axis. Two distinct peaks were evident for protease produced from pRK793, labeled 1 and 2. These peaks contained truncated and full-length protease, respectively, as indicated by ESI mass spectrometry. Protease produced from pQE30-S219V had a mass consistent with full-length protease.
Figure 6
A comparison of the solubility of TEV protease dependent on expression temperature and the nature of the C-terminal tag present. T, total cell lysate; S, soluble fraction of the total cell lysate, and I, the insoluble fraction of the lysate. Gel A shows that His6-TEV-pR5 expressed from pQE30-S219VpR5 at 37 °C is entirely insoluble. Gel B shows that His6-TEV-pR5 expressed from pQE30-S219VpR5 at 25 °C is a doublet that partitioned between the soluble and the insoluble fraction. Other work presented here shows the soluble protein is primarily proteolyzed His6-TEV-R, while the insoluble fraction contains both His6-TEV-R and His6-TEV-pR5.
Figure 7
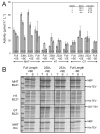
A, activity assays of small-scale expression cultures with fusion tag and C-terminal variants of TEV protease. Solubility enhancing mutations were either present (+SE) or absent (−SE). The expression studies were completed at 25°C in terrific broth using IPTG or auto-induction and E. coli expression strains BL21 or Krx. Error bars represent two standard deviations above and below the mean for measurements conducted in quadruplicate. B, SDS-PAGE gels are shown in Panel B for IPTG induced expression in BL21 for all fusion variants and from expression of MHT variants in E. coli Krx. Total (T), soluble (S), and insoluble fractions (I) were run. The expressed proteins are indicated with arrows.
Figure 8
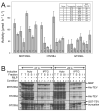
A, activity assays for expression of TEV237Δ with different fusion tags (MBP, MHT238Δ; His-tag, HT238Δ or GST, GT238Δ) and other different conditions. The enzyme activity in recombinant E. coli BL21 cell lysates was measured in quadruplicate with error bars representing two standard deviations above and below the mean. The inset defines the different expression conditions of the bar graph. B, SDS-PAGE analysis of the protein expression from A. Total (T), soluble (S), and insoluble (I) protein fractions are labeled. The gel lanes used to separate the insoluble protein lanes were constricted by the higher salt concentration present in the total and soluble samples.
Figure 9
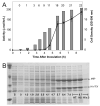
Expression of TEV protease during auto-induction from MHT238Δ in a 10-L fermenter. A, correlation of TEV protease activity and cell density with duration of the fermentation. Error bars for the activity measurements represent two standard deviations above and below the mean. Cell densities are shown as bars and as numbers across the top of the plot. B, SDS-PAGE analysis. Expressed MBP-His7-TEV237Δ fusion protein is cleaved during cell growth to separate MBP and His7-TEV237Δ. Arrows indicate the position of MBP and His7-TEV after in vivo cleavage. The lane marked S contains a sample of the starting inoculum grown in a non-inducing medium. The lanes marked with time correspond to the data points indicated in A. The lanes marked HT, HS, and HI are the total, soluble, and insoluble fractions obtained at harvest, 8.7 h after inoculation. The amount of sample loaded was normalized by cell density for all lanes except the insoluble harvest sample, which was loaded at 3× the normalized amount to allow better visualization.
Figure 10
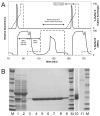
Results from the automated two-step purification of MHT238Δ. A, absorbance and gradient profiles for the two-step purification. The lower solid line shows the absorbance profile during the 2nd cycle of sample injection, wash, and elution steps and the 3rd cycle of sample injection for the IMAC purification. The upper solid line shows the absorbance profile for the 1st and 2nd cation exchange steps. The dashed lines indicate the percentage mixture of buffer B during the IMAC step and buffer D during the cation exchange step. The area of elution peaks cannot be directly compared due to the different flow rates during IMAC and cation exchange elution steps. B, characterization of the purification results by SDS-PAGE. Lane 1 is the cell-free lysate and lanes 2 and 3 are the IMAC and cation exchange waste products. The waste products were concentrated using a 10-kDa molecular weight cut off centrifugal concentrator to the same volume as the cell lysate for easier visual comparison. Lanes 4 through 9 are the purified TEV protease obtained from purification cycles 1 through 6. Lane 10 shows a higher loading (50 μg) of the sample from lane 5 (10 μg) and lane 11 contains 312 ng of bovine serum albumin standard run on the same gel as lane 10.
Figure 11
An SDS-PAGE analysis of GST-TEV protease purification. Lane 1, cell lysate. Lane 2, glutathione Sepharose column flow-through. Lane 3, glutathione Sepharose column wash. Lanes 4–6, glutathione Sepharose elution fractions. Lane 7, pooled fractions after size exclusion chromatography.
Similar articles
- Expression and purification of soluble His(6)-tagged TEV protease.
Tropea JE, Cherry S, Waugh DS. Tropea JE, et al. Methods Mol Biol. 2009;498:297-307. doi: 10.1007/978-1-59745-196-3_19. Methods Mol Biol. 2009. PMID: 18988033 - Production, purification and characterization of a double-tagged TEV protease.
Rizza JD, Ortega C, Carrión F, Fló M, Correa A. Rizza JD, et al. Protein Expr Purif. 2022 Mar;191:106021. doi: 10.1016/j.pep.2021.106021. Epub 2021 Nov 16. Protein Expr Purif. 2022. PMID: 34798273 - A new tagged-TEV protease: construction, optimisation of production, purification and test activity.
Miladi B, Bouallagui H, Dridi C, El Marjou A, Boeuf G, Di Martino P, Dufour F, Elm'Selmi A. Miladi B, et al. Protein Expr Purif. 2011 Jan;75(1):75-82. doi: 10.1016/j.pep.2010.08.012. Epub 2010 Sep 9. Protein Expr Purif. 2011. PMID: 20817099 - Improved yield, stability, and cleavage reaction of a novel tobacco etch virus protease mutant.
Enríquez-Flores S, De la Mora-De la Mora JI, Flores-López LA, Cabrera N, Fernández-Lainez C, Hernández-Alcántara G, Guerrero-Beltrán CE, López-Velázquez G, García-Torres I. Enríquez-Flores S, et al. Appl Microbiol Biotechnol. 2022 Feb;106(4):1475-1492. doi: 10.1007/s00253-022-11786-5. Epub 2022 Jan 29. Appl Microbiol Biotechnol. 2022. PMID: 35092453 Review. - In vivo cleavage of solubility tags as a tool to enhance the levels of soluble recombinant proteins in Escherichia coli.
Silva FSR, Santos SPO, Meyer R, Silva ES, Pinheiro CS, Alcantara-Neves NM, Pacheco LGC. Silva FSR, et al. Biotechnol Bioeng. 2021 Nov;118(11):4159-4167. doi: 10.1002/bit.27912. Epub 2021 Aug 14. Biotechnol Bioeng. 2021. PMID: 34370304 Review.
Cited by
- Numaswitch: an efficient high-titer expression platform to produce peptides and small proteins.
Nguyen BN, Tieves F, Rohr T, Wobst H, Schöpf FS, Solano JDM, Schneider J, Stock J, Uhde A, Kalthoff T, Jaeger KE, Schmitt L, Schwarz C. Nguyen BN, et al. AMB Express. 2021 Mar 25;11(1):48. doi: 10.1186/s13568-021-01204-w. AMB Express. 2021. PMID: 33765268 Free PMC article. - Expression and crystallization of SeDsbA, SeDsbL and SeSrgA from Salmonella enterica serovar Typhimurium.
Jarrott R, Shouldice SR, Guncar G, Totsika M, Schembri MA, Heras B. Jarrott R, et al. Acta Crystallogr Sect F Struct Biol Cryst Commun. 2010 May 1;66(Pt 5):601-4. doi: 10.1107/S1744309110011942. Epub 2010 Apr 30. Acta Crystallogr Sect F Struct Biol Cryst Commun. 2010. PMID: 20445269 Free PMC article. - A candidate activation pathway for coagulation factor VII.
Misenheimer TM, Kumfer KT, Bates BE, Nettesheim ER, Schwartz BS. Misenheimer TM, et al. Biochem J. 2019 Oct 15;476(19):2909-2926. doi: 10.1042/BCJ20190595. Biochem J. 2019. PMID: 31537632 Free PMC article. - Engineered solubility tag for solution NMR of proteins.
Ruschak AM, Rose JD, Coughlin MP, Religa TL. Ruschak AM, et al. Protein Sci. 2013 Nov;22(11):1646-54. doi: 10.1002/pro.2337. Epub 2013 Sep 20. Protein Sci. 2013. PMID: 23963792 Free PMC article. - A HaloTag-TEV genetic cassette for mechanical phenotyping of proteins from tissues.
Rivas-Pardo JA, Li Y, Mártonfalvi Z, Tapia-Rojo R, Unger A, Fernández-Trasancos Á, Herrero-Galán E, Velázquez-Carreras D, Fernández JM, Linke WA, Alegre-Cebollada J. Rivas-Pardo JA, et al. Nat Commun. 2020 Apr 28;11(1):2060. doi: 10.1038/s41467-020-15465-9. Nat Commun. 2020. PMID: 32345978 Free PMC article.
References
- Georgiou G, Valax P. Expression of correctly folded proteins in Escherichia coli. Curr Opin Biotechnol. 1996;7:190–197. - PubMed
- Sreenath HK, Bingman CA, Buchan BW, Seder KD, Burns BT, Geetha HV, Jeon WB, Vojtik FC, Aceti DJ, Frederick RO, Phillips GN, Jr, Fox BG. Protocols for production of selenomethionine-labeled proteins in 2-L polyethylene terephthalate bottles using auto-induction medium. Protein Expr Purif. 2005;40:256–267. - PubMed
- Adams SR, Campbell RE, Gross LA, Martin BR, Walkup GK, Yao Y, Llopis J, Tsien RY. New biarsenical ligands and tetracysteine motifs for protein labeling in vitro and in vivo: synthesis and biological applications. J Amer Chem Soc. 2002;124:6063–6076. - PubMed
Publication types
MeSH terms
Substances
Grants and funding
- T32 GM08349/GM/NIGMS NIH HHS/United States
- U54 GM074901-03/GM/NIGMS NIH HHS/United States
- 1 U54 GM 74901/GM/NIGMS NIH HHS/United States
- T32 GM008349/GM/NIGMS NIH HHS/United States
- U54 GM074901/GM/NIGMS NIH HHS/United States
LinkOut - more resources
Full Text Sources
Other Literature Sources

