Dendritic cell quiescence during systemic inflammation driven by LPS stimulation of radioresistant cells in vivo - PubMed (original) (raw)
Comparative Study
. 2007 Jun 11;204(6):1487-501.
doi: 10.1084/jem.20070325. Epub 2007 Jun 4.
Affiliations
- PMID: 17548522
- PMCID: PMC2118612
- DOI: 10.1084/jem.20070325
Comparative Study
Dendritic cell quiescence during systemic inflammation driven by LPS stimulation of radioresistant cells in vivo
Martijn A Nolte et al. J Exp Med. 2007.
Abstract
Dendritic cell (DC) activation is a prerequisite for T cell priming. During infection, activation can ensue from signaling via pattern-recognition receptors after contact with pathogens or infected cells. Alternatively, it has been proposed that DCs can be activated indirectly by signals produced by infected tissues. To address the contribution of tissue-derived signals, we measured DC activation in a model in which radioresistant cells can or cannot respond to lipopolysaccharide (LPS). We report that recognition of LPS by the radioresistant compartment is sufficient to induce local and systemic inflammation characterized by high circulating levels of tumor necrosis factor (TNF) alpha, interleukin (IL) 1beta, IL-6, and CC chemokine ligand 2. However, this is not sufficient to activate DCs, whether measured by migration, gene expression, phenotypic, or functional criteria, or to render DC refractory to subsequent stimulation with CpG-containing DNA. Similarly, acute or chronic exposure to proinflammatory cytokines such as TNF-alpha +/- interferon alpha/beta has marginal effects on DC phenotype in vivo when compared with LPS. In addition, DC activation and migration induced by LPS is unimpaired when radioresistant cells cannot respond to the stimulus. Thus, inflammatory mediators originating from nonhematopoietic tissues and from radioresistant hematopoietic cells are neither sufficient nor required for DC activation in vivo.
Figures
Figure 1.
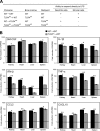
TLR4 stimulation of radioresistant cells induces local organ inflammation. (A) Experimental design. (B) Relative mRNA expression of GM-CSF, IL-1β, IFN-β, TNF-α, CCL2, and CXCL10 in the kidney, heart, liver, and spleen of WT→WT mice or TLR40/0→WT mice 1 h after intravenous injection of 10 μg PBS or LPS per mouse. Expression of each gene was normalized to the expression of 18S rRNA and is shown as the fold induction of LPS over PBS. Data are the means ± SD of triplicate determinations. Expression of all genes was significantly up-regulated by LPS compared with PBS (P < 0.05 using the Student's t test), except for IFN-β in the liver of TLR40/0→WT mice (significant down-regulation) and for IFN-β in the hearts of TLR40/0→WT mice (not significant). Significant differences between WT→WT and TLR40/0→WT mice are indicated. * and **, P < 0.05 and 0.01, respectively, using the Student's t test.
Figure 2.
Both hematopoietic and nonhematopoietic cells contribute to LPS-induced systemic inflammation. (A) The concentration of TNF-α, IL-6, IL-1β, and CCL2 was determined in sera of WT→WT, TLR40/0→WT, WT→TLR40/0, and TLR40/0→TLR40/0 chimeric mice 6 h after injection of either PBS or LPS. (B) Similar analysis of TNF-α, IL-6, and CCL2 in serum from WT→WT and TLR40/0→WT at 1 h after injection. Data in A are the means ± SD of two to three mice. Each point in B represents an individual mouse, and the mean ± SD is also shown. Significant differences between groups are indicated. * and **, P < 0.05 and 0.01, respectively, using the Student's t test.
Figure 3.
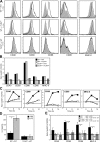
LPS stimulation of radioresistant cells does not lead to DC activation. (A) Surface expression of CD40, CD80, CD86, CD95, and MHC class II (I-Ad) was determined on gated CD11chi cells from spleens isolated from WT→WT (top), WT→TLR40/0 (middle), and TLR40/0→WT (bottom) mice 6 h after injection with PBS (shaded histogram) or LPS (continuous line). (B) Geometric mean fluorescence intensity (GeoMFI) values were determined at 6 h after injection and expressed as a ratio of LPS/PBS for WT→WT, WT→TLR40/0, TLR40/0→WT, and TLR40/0→TLR40/0 mice. (C) Induction of surface expression of co-stimulatory molecules by LPS compared with PBS, gated on CD11chi cells from spleens isolated 6 or 14 h after injection into WT→WT (closed squares) or TLR40/0→WT (open squares) mice. (D) Concentration of IL-6 in overnight culture supernatant of CD11chiB220− DCs sorted from spleens of WT→WT or TLR40/0→WT mice 6 h after injection of PBS or LPS. Results indicate means ± SD of triplicate wells. (E) 1 μg PBS or LPS was injected into the hind footpads (left vs. right, respectively) of WT→WT or TLR4−/−→WT mice, and draining (popliteal) and nondraining (axillary) lymph nodes were isolated 6 h later. Surface expression of co-stimulatory molecules was determined on CD11chi cells and expressed as a ratio of LPS/PBS within one mouse. Results indicate means ± SD of two (WT→WT) or three (TLR4−/−→WT) mice. *, P < 0.05 between the indicated groups using the Student's t test.
Figure 4.
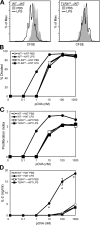
LPS activation of radioresistant cells does not result in functional DC maturation. CFSE-labeled DO11.10 T cells were stimulated with pOVA and paraformaldehyde-fixed CD11c-enriched cells from spleens isolated from chimeric mice 6 h after injection of PBS or LPS. CFSE profiles were analyzed after 96 h and gated for DAPI−CD4+KJ1-26+ cells. (A) CFSE profile of DO11.10 T cells stimulated with 10 nM pOVA and DCs from WT→WT mice (left) or TLR40/0→WT mice (right) that had been injected with PBS or LPS. (B) Percentage of T cells that divided expressed as a function of pOVA concentration. (C) Proliferation index (mean number of divisions undergone by dividing cells) expressed as a function of pOVA concentration. (D) IL-2 levels in culture supernatants after 96 h, expressed as a function of pOVA concentration. Data are the means ± SD of triplicate wells. *, P < 0.01 between groups using the Student's t test.
Figure 5.
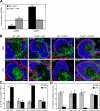
Activation of nonhematopoietic cells by LPS is not sufficient or required for migration of splenic DCs to the PALS. (A) Expression of mRNA for CCR6 and CCR7 in sorted splenic DCs from WT→WT mice or TLR40/0→WT mice at 6 h after injection of PBS or LPS. Values were normalized to the expression of 18S rRNA and expressed as the fold induction of LPS over PBS. Results indicate the means ± SD of triplicate wells. *, P < 0.01 for the expression level induced by LPS using the Student's t test. (B) Localization of CD11c+ cells (green) was determined in spleens of chimeric mice 6 h after injection of PBS (top) or LPS (bottom). White pulp area was delineated by MAdCAM-1+ sinus-lining cells in the marginal zone (red), while B cells areas were visualized by staining for B220 (blue). Bar, 100 μm. The percentage of CD11c+ staining present in the PALS (C) or in the red pulp (D) was determined in all four chimera groups after injection with PBS or LPS. Results indicate means ± SD from three to six analyzed wide-field images. *, P < 0.001 between PBS- and LPS-injected mice using the Student's t test.
Figure 6.
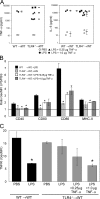
Increasing serum TNF-α levels is not sufficient to induce complete DC activation. (A) Serum concentration of TNF-α and IL-6 was determined in the sera of WT→WT and TLR4−/−→WT chimeric mice 1 h after injection with either PBS (open circles), LPS (closed circles), LPS plus 0.25 μg TNF-α (closed triangles), or LPS plus 1 μg TNF-α (closed squares). (B) Surface expression of co-stimulatory molecules on CD11chi cells from spleens isolated 6 h after injection of LPS ± TNF-α into WT→WT or TLR4−/−→WT mice. Data are expressed as a ratio of LPS/PBS. *, P < 0.05 using the Student's t test for LPS-injected WT→WT mice. (C) Surface expression of TNF-RI on the same DCs described in B, expressed as GeoMFI. Results (A–C) are means ± SD from two to three mice per group. *, P < 0.05 shows significantly lower TNF-RI expression compared with PBS injection.
Figure 7.
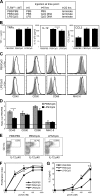
DCs exposed to stromal-driven inflammation respond normally to subsequent direct TLR stimulation. (A) Experimental setup. (B) Levels of TNF-α, IL-12 p70, and CCL2 in sera of PBS/PBS-, PBS/CpG-, and LPS/CpG-injected TLR40/0→WT mice. Results indicate means ± SD from four individual mice. (C) Surface expression profiles for CD40, CD80, CD86, and MHC class II (I-Ad) on CD11chi-gated splenocytes from PBS/PBS-injected mice (shaded histograms) overlaid with the profiles of PBS/CpG-injected mice (continuous line, top) or LPS/CpG-injected mice (continuous line, bottom). (D) As in C, but expressed as the ratio of GeoMFI values for PBS/CpG-injected mice or LPS/CpG-injected mice to PBS/PBS-injected mice. Results indicate means ± SD from two mice per group. Expression of all molecules was significantly up-regulated compared with PBS/PBS-injected mice (P < 0.05 using the Student's t test), except for MHC class II in PBS/CpG injected mice. (E) Intracellular IL-12 p40 staining on CD11c-enriched splenocytes from PBS/PBS- (left), PBS/CpG- (middle), and LPS/CpG-injected (right) mice. Numbers in boxes indicate the percentage of all cells shown that produce IL-12 p40. (F) Proliferation index (average number of divisions undergone by dividing cells) of CFSE-labeled DO11.10 T cells analyzed after 96 h of co-culture with pOVA and paraformaldehyde-fixed, CD11c-enriched cells from PBS/PBS-, PBS/CpG-, or LPS/CpG-injected mice. (G) IL-2 concentration in the culture supernatants from F, depicted as the mean ± SD of triplicate wells. *, P < 0.05 between indicated groups (B and D) or between PBS/PBS-injected mice and either PBS/CpG- or LPS/CpG-injected mice (F and G), using the Student's t test.
Similar articles
- IL-21 enhances SOCS gene expression and inhibits LPS-induced cytokine production in human monocyte-derived dendritic cells.
Strengell M, Lehtonen A, Matikainen S, Julkunen I. Strengell M, et al. J Leukoc Biol. 2006 Jun;79(6):1279-85. doi: 10.1189/jlb.0905503. Epub 2006 Mar 21. J Leukoc Biol. 2006. PMID: 16551679 - Selective synergy in anti-inflammatory cytokine production upon cooperated signaling via TLR4 and TLR2 in murine conventional dendritic cells.
Hirata N, Yanagawa Y, Ebihara T, Seya T, Uematsu S, Akira S, Hayashi F, Iwabuchi K, Onoé K. Hirata N, et al. Mol Immunol. 2008 May;45(10):2734-42. doi: 10.1016/j.molimm.2008.02.010. Epub 2008 Mar 26. Mol Immunol. 2008. PMID: 18372043 - Isoflavones, genistein and daidzein, regulate mucosal immune response by suppressing dendritic cell function.
Wei J, Bhatt S, Chang LM, Sampson HA, Masilamani M. Wei J, et al. PLoS One. 2012;7(10):e47979. doi: 10.1371/journal.pone.0047979. Epub 2012 Oct 22. PLoS One. 2012. PMID: 23110148 Free PMC article. - Sepsis Inflammation Impairs the Generation of Functional Dendritic Cells by Targeting Their Progenitors.
Lu J, Sun K, Yang H, Fan D, Huang H, Hong Y, Wu S, Zhou H, Fang F, Li Y, Meng L, Huang J, Bai Z. Lu J, et al. Front Immunol. 2021 Sep 9;12:732612. doi: 10.3389/fimmu.2021.732612. eCollection 2021. Front Immunol. 2021. PMID: 34566996 Free PMC article. - Inflammatory signals in dendritic cell activation and the induction of adaptive immunity.
Joffre O, Nolte MA, Spörri R, Reis e Sousa C. Joffre O, et al. Immunol Rev. 2009 Jan;227(1):234-47. doi: 10.1111/j.1600-065X.2008.00718.x. Immunol Rev. 2009. PMID: 19120488 Review.
Cited by
- Immune mechanisms of protection: can adjuvants rise to the challenge?
McKee AS, MacLeod MK, Kappler JW, Marrack P. McKee AS, et al. BMC Biol. 2010 Apr 12;8:37. doi: 10.1186/1741-7007-8-37. BMC Biol. 2010. PMID: 20385031 Free PMC article. Review. - TRAF3 controls activation of the canonical and alternative NFkappaB by the lymphotoxin beta receptor.
Bista P, Zeng W, Ryan S, Bailly V, Browning JL, Lukashev ME. Bista P, et al. J Biol Chem. 2010 Apr 23;285(17):12971-8. doi: 10.1074/jbc.M109.076091. Epub 2010 Feb 25. J Biol Chem. 2010. PMID: 20185819 Free PMC article. - Allergen recognition by innate immune cells: critical role of dendritic and epithelial cells.
Salazar F, Ghaemmaghami AM. Salazar F, et al. Front Immunol. 2013 Nov 4;4:356. doi: 10.3389/fimmu.2013.00356. Front Immunol. 2013. PMID: 24204367 Free PMC article. Review. - Reversing immune dysfunction and liver damage after direct-acting antiviral treatment for hepatitis C.
Mazouz S, Boisvert M, Shoukry NH, Lamarre D. Mazouz S, et al. Can Liver J. 2018 Jul 17;1(2):78-105. doi: 10.3138/canlivj.1.2.007. eCollection 2018 Spring. Can Liver J. 2018. PMID: 35990715 Free PMC article. Review. - Direct activation of antigen-presenting cells is required for CD8+ T-cell priming and tumor vaccination.
Kratky W, Reis e Sousa C, Oxenius A, Spörri R. Kratky W, et al. Proc Natl Acad Sci U S A. 2011 Oct 18;108(42):17414-9. doi: 10.1073/pnas.1108945108. Epub 2011 Oct 10. Proc Natl Acad Sci U S A. 2011. PMID: 21987815 Free PMC article.
References
- Janeway, C.A., Jr. 1989. Approaching the asymptote? Evolution and revolution in immunology. Cold Spring Harb. Symp. Quant. Biol. 54:1–13. - PubMed
- Akira, S., S. Uematsu, and O. Takeuchi. 2006. Pathogen recognition and innate immunity. Cell. 124:783–801. - PubMed
- Rakoff-Nahoum, S., J. Paglino, F. Eslami-Varzaneh, S. Edberg, and R. Medzhitov. 2004. Recognition of commensal microflora by toll-like receptors is required for intestinal homeostasis. Cell. 118:229–241. - PubMed
- Iwasaki, A., and R. Medzhitov. 2004. Toll-like receptor control of the adaptive immune responses. Nat. Immunol. 5:987–995. - PubMed
- Reis e Sousa, C. 2004. Activation of dendritic cells: translating innate into adaptive immunity. Curr. Opin. Immunol. 16:21–25. - PubMed
Publication types
MeSH terms
Substances
LinkOut - more resources
Full Text Sources
Molecular Biology Databases
