Global distribution of negative cofactor 2 subunit-alpha on human promoters - PubMed (original) (raw)
Global distribution of negative cofactor 2 subunit-alpha on human promoters
Thomas K Albert et al. Proc Natl Acad Sci U S A. 2007.
Abstract
Negative cofactor 2 (NC2) forms a stable complex with TATA-binding protein (TBP) on promoters in vitro. Its association with TBP prevents the binding of TFIIB and leads to inhibition of preinitiation complex formation. Here, we investigate the association of NC2 subunit-alpha with human RNA polymerase II promoter regions by using gene-specific ChIP and genome-wide promoter ChIPchip analyses. We find NC2alpha associated with a large number of human promoters, where it peaks close to the core regions. NC2 occupancy in vivo positively correlates with mRNA levels, which perhaps reflects its capacity to stabilize TBP on promoter regions. In single gene analyses, we confirm core promoter binding and in addition map the NC2 complex to enhancer proximal regions. High-occupancy histone genes display a stable NC2/TFIIB ratio during the cell cycle, which otherwise varies markedly from one gene to another. The latter is at least in part explained by an observed negative correlation of NC2 occupancy with the presence of the TFIIB recognition element in core promoter regions. Our data establish the genome-wide basis for general and gene-specific functions of NC2 in mammalian cells.
Conflict of interest statement
The authors declare no conflict of interest.
Figures
Fig. 1.
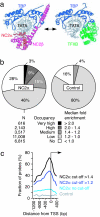
Genome-wide promoter association of NC2α. (a) Structure of the NC2–TBP–TATA complex (31) and of the TFIIB–TBP–TATA complex (38). (b) Charts showing the distribution of enrichment classes of 24,099 human promoters in a NC2α ChIP (Left) and an isotype IgG control ChIP (Right) performed in LCL721 B cells. Five enrichment classes were ranked according to the indicated median fold enrichments on 15 probes per individual promoter. (c) Distribution of the distance between NC2α-bound probes and the closest transcription start site (TSS). The fraction of bound probes that map to 100-bp intervals from the TSS at the indicated cut-offs is shown. The averaged distribution of the nonthresholded NC2α (no cut-off) and control ChIPchip set is also depicted.
Fig. 2.
NC2α ChIPchip profile on individual promoters. Shown are NC2α occupancies at the selected ribosomal protein gene RPL7A (Left) and at the RNA processing factor gene CSTF3 (Right) in LCL721 cells. Log2 ratios of the NC2α ChIP versus input DNA on individual array probes are plotted. The approximate width of the peak area is outlined. The broken arrows mark transcription start sites.
Fig. 3.
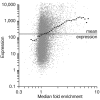
Positive correlation of NC2α occupancy and gene expression. Scatter plot depicting NC2α occupancy (median fold enrichment of NimbleGen probe sets, x axis) and corresponding gene expression (Affymetrix probe set signals, y axis) in LCL721 cells. A moving average of NC2α enrichment on genes (window size 0.5, step size 0.1) is indicated by black dots. The horizontal line represents the mean of signals on all Affymetrix probe sets.
Fig. 4.
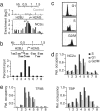
NC2 occupancy of histone genes. (a) ChIPchip profile of NC2α occupancy at the histone H2BJ-H2AG locus (log2 scale; y axis). For comparison, the binding profile from the control ChIP is shown above the bar graph. (b) ChIPchip validation of NC2 binding to H2BJ-H2AG in Jurkat cells by qPCR. Relative positions of amplicons 1–8 are shown above the bar graph. (c) FACS analysis of elutriated Raji cell fractions in G1, S, and G2/M phase. (d and e) Conventional ChIP analysis of relative NC2α (d) and TFIIB and TBP (e) occupancy levels at H2BJ-H2AG in phased Raji cells.
Fig. 5.
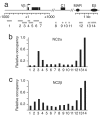
NC2 binding to TCRβ. (a) Scheme of the rearranged TCRβ locus in Jurkat cells. The functional transcription unit extends from the variable region Vβ to constant region C1. Distal downstream elements such as matrix attachment region (MAR) and the 3′ enhancer (Eβ) are also shown. The numbered gray boxes indicate the qPCR amplicons used to monitor binding of NC2α (b) and NC2β (c) in Jurkat T cells.
Fig. 6.
NC2 occupancy at core promoters. (a) Relation between frequencies of core promoter elements and NC2α occupancy. The indicated NC2α enrichment classes were referenced to a survey of the core promoter composition of 9,010 annotated transcription start site sequences (24) to relate the relative frequency of TATA box (TATA), initiator (INR), downstream promoter element (DPE), TFIIB recognition element (BRE), and motif 10 element (MTE) to NC2α occupancy levels. (b) Core promoter regions of the indicated genes were assayed by conventional qPCR for occupancy by NC2α (red bars), TFIIB (green bars), and TBP (black bars). Values represent mean and standard deviation of two independent ChIP experiments. The genes are sorted from left to right to reflect increasing median fold enrichment values on the microarray, with the vertical line indicating the threshold of 1.2-fold enrichment (compare with
SI Table 1
). Chr.7 control denotes a transcriptionally inactive intergenic region on chromosome 7 that was used as a reference.
Similar articles
- Basal core promoters control the equilibrium between negative cofactor 2 and preinitiation complexes in human cells.
Albert TK, Grote K, Boeing S, Meisterernst M. Albert TK, et al. Genome Biol. 2010;11(3):R33. doi: 10.1186/gb-2010-11-3-r33. Epub 2010 Mar 15. Genome Biol. 2010. PMID: 20230619 Free PMC article. - Yeast NC2 associates with the RNA polymerase II preinitiation complex and selectively affects transcription in vivo.
Geisberg JV, Holstege FC, Young RA, Struhl K. Geisberg JV, et al. Mol Cell Biol. 2001 Apr;21(8):2736-42. doi: 10.1128/MCB.21.8.2736-2742.2001. Mol Cell Biol. 2001. PMID: 11283253 Free PMC article. - Efficient binding of NC2.TATA-binding protein to DNA in the absence of TATA.
Gilfillan S, Stelzer G, Piaia E, Hofmann MG, Meisterernst M. Gilfillan S, et al. J Biol Chem. 2005 Feb 18;280(7):6222-30. doi: 10.1074/jbc.M406343200. Epub 2004 Nov 30. J Biol Chem. 2005. PMID: 15574413 - TRF2: TRansForming the view of general transcription factors.
Zehavi Y, Kedmi A, Ideses D, Juven-Gershon T. Zehavi Y, et al. Transcription. 2015;6(1):1-6. doi: 10.1080/21541264.2015.1004980. Epub 2015 Jan 14. Transcription. 2015. PMID: 25588059 Free PMC article. Review. - Mammalian RNA polymerase II core promoters: insights from genome-wide studies.
Sandelin A, Carninci P, Lenhard B, Ponjavic J, Hayashizaki Y, Hume DA. Sandelin A, et al. Nat Rev Genet. 2007 Jun;8(6):424-36. doi: 10.1038/nrg2026. Epub 2007 May 8. Nat Rev Genet. 2007. PMID: 17486122 Review.
Cited by
- RNA polymerase II C-terminal heptarepeat domain Ser-7 phosphorylation is established in a mediator-dependent fashion.
Boeing S, Rigault C, Heidemann M, Eick D, Meisterernst M. Boeing S, et al. J Biol Chem. 2010 Jan 1;285(1):188-96. doi: 10.1074/jbc.M109.046565. Epub 2009 Nov 9. J Biol Chem. 2010. PMID: 19901026 Free PMC article. - Tracking the roots of cellulase hyperproduction by the fungus Trichoderma reesei using massively parallel DNA sequencing.
Le Crom S, Schackwitz W, Pennacchio L, Magnuson JK, Culley DE, Collett JR, Martin J, Druzhinina IS, Mathis H, Monot F, Seiboth B, Cherry B, Rey M, Berka R, Kubicek CP, Baker SE, Margeot A. Le Crom S, et al. Proc Natl Acad Sci U S A. 2009 Sep 22;106(38):16151-6. doi: 10.1073/pnas.0905848106. Epub 2009 Sep 2. Proc Natl Acad Sci U S A. 2009. PMID: 19805272 Free PMC article. - TBP, Mot1, and NC2 establish a regulatory circuit that controls DPE-dependent versus TATA-dependent transcription.
Hsu JY, Juven-Gershon T, Marr MT 2nd, Wright KJ, Tjian R, Kadonaga JT. Hsu JY, et al. Genes Dev. 2008 Sep 1;22(17):2353-8. doi: 10.1101/gad.1681808. Epub 2008 Aug 14. Genes Dev. 2008. PMID: 18703680 Free PMC article. - Ncb2 is involved in activated transcription of CDR1 in azole-resistant clinical isolates of Candida albicans.
Shukla S, Yadav V, Mukhopadhyay G, Prasad R. Shukla S, et al. Eukaryot Cell. 2011 Oct;10(10):1357-66. doi: 10.1128/EC.05041-11. Epub 2011 Aug 19. Eukaryot Cell. 2011. PMID: 21856931 Free PMC article. - Cooperative action of NC2 and Mot1p to regulate TATA-binding protein function across the genome.
van Werven FJ, van Bakel H, van Teeffelen HA, Altelaar AF, Koerkamp MG, Heck AJ, Holstege FC, Timmers HT. van Werven FJ, et al. Genes Dev. 2008 Sep 1;22(17):2359-69. doi: 10.1101/gad.1682308. Epub 2008 Aug 14. Genes Dev. 2008. PMID: 18703679 Free PMC article.
References
- Roeder RG. Trends Biochem Sci. 1996;21:327–335. - PubMed
- Thomas MC, Chiang CM. Crit Rev Biochem Mol Biol. 2006;41:105–178. - PubMed
- Meisterernst M, Roeder RG. Cell. 1991;67:557–567. - PubMed
- Inostroza JA, Mermelstein FH, Ha I, Lane WS, Reinberg D. Cell. 1992;70:477–489. - PubMed
Publication types
MeSH terms
Substances
LinkOut - more resources
Full Text Sources


