Clearance of an immunosuppressive virus from the CNS coincides with immune reanimation and diversification - PubMed (original) (raw)
Clearance of an immunosuppressive virus from the CNS coincides with immune reanimation and diversification
Henning Lauterbach et al. Virol J. 2007.
Abstract
Once a virus infection establishes persistence in the central nervous system (CNS), it is especially difficult to eliminate from this specialized compartment. Therefore, it is of the utmost importance to fully understand scenarios during which a persisting virus is ultimately purged from the CNS by the adaptive immune system. Such a scenario can be found following infection of adult mice with an immunosuppressive variant of lymphocytic choriomeningitis virus (LCMV) referred to as clone 13. In this study we demonstrate that following intravenous inoculation, clone 13 rapidly infected peripheral tissues within one week, but more slowly innundated the entire brain parenchyma over the course of a month. During the establishment of persistence, we observed that genetically tagged LCMV-specific cytotoxic T lymphocytes (CTL) progressively lost function; however, the severity of this loss in the CNS was never as substantial as that observed in the periphery. One of the most impressive features of this model system is that the peripheral T cell response eventually regains functionality at ~60-80 days post-infection, and this was associated with a rapid decline in virus from the periphery. Coincident with this "reanimation phase" was a massive influx of CD4 T and B cells into the CNS and a dramatic reduction in viral distribution. In fact, olfactory bulb neurons served as the last refuge for the persisting virus, which was ultimately purged from the CNS within 200 days post-infection. These data indicate that a functionally revived immune response can prevail over a virus that establishes widespread presence both in the periphery and brain parenchyma, and that therapeutic enhancement of an existing response could serve as an effective means to thwart long term CNS persistence.
Figures
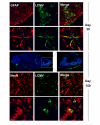
Figure 2
Clone 13 tropism in the brain parenchyma during persistence. The localization of clone 13 in the brain parenchyma was examined at various time points post-infection by two-color confocal microscopy. During the first 60 days the virus (green) was found primarily in GFAP+ astrocytes (red). Representative low (first row) and high (second row) magnification images are shown for a mouse (n = 3 mice per group) at day 31 p.i. The third row shows a whole brain reconstruction from a mouse (n = 3 mice per group) at day 150 and an enlarged panel of the olfactory bulb. Virus is shown in green and cell nuclei in blue. In the late phase of persistence (day 150), the virus (green) was found primarily in NeuN+ olfactory bulb neurons (red). Low and high magnification examples are shown in the fourth and fifth rows, respectively.
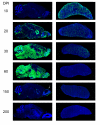
Figure 1
Distribution of LCMV in the brain and spleen following an intravenous clone 13 infection. Representative sagittal brain and spleen reconstructions (n = 3 mice per group) were assembled at the denoted time points post-infection to reveal the distribution of LCMV (green) following an intravenous infection with 2 × 10⁶ PFU of clone 13. Note the minimal amount of virus in the brain at day 10 and the complete inundation of the brain parenchyma by day 30. During the late phase of persistence (day 150), clone 13 localizes primarily to the olfactory bulb (white arrow) and also maintains a presence in the meninges, choroid plexus, ependyma, and subventricular zone. Note that the spleen shows the highest viral antigen load at day 10 and is progressively purged of virus over time. Cell nuclei are shown in blue.
Figure 3
Neurotropic LCMV Armstrong is not selected for in the CNS of clone 13 infected mice. RNA was isolated from LCMV clones extracted from the brains of mice at 21 (n = 7 clones) and 150 days (n = 6 clones) post-clone 13 infection. RT-PCR, PCR and Mnl I restriction enzyme digests were performed as described in the Materials and Methods. The RNA PCR product from the Armstrong GP contains a phenylalanine at position 260 and is not cleaved by Mnl I. In contrast, clone 13 contains a leucine at position 260, and the 362 bp PCR product is cleaved into fragments (202 and 160 bp) by Mnl I. Note that all clones analyzed at both time points had the Mnl I restriction enzyme site. The control lane shows undigested 362 bp GP PCR product.
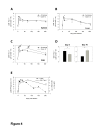
Figure 4
Kinetics of the LCMV specific CD8 T cell response. Mice were seeded with Thy1.1+DbGP33–41 specific CD8+ T cells (P14 cells) and infected one day later with 2 × 10⁶ PFU of Armstrong or clone 13. Mononuclear cells were isolated from the A) spleen, B) liver and C) CNS at the indicated time points following intracardiac perfusion to remove contaminating blood cells. The absolute number of P14 cells in each tissue was determined by flow cytometry. A log fewer CTL was found in the CNS of clone 13 infected mice at day 8 p.i. (first black arrow), and a significant elevation in P14 cells was observed at day 71 (second black arrow). Values represent the mean ± standard deviation (SD) of three mice per group at each time point. No significant differences were noted in the spleen or liver (two representative peripheral tissues). D) To confirm the findings in panel C, CNS P14 cells were quantified in a separate experiment (n = 4 to 7 mice per group) at an early (day 8) and late (day 70) time point post-infection. Note the significant reduction in P14 cells at day 8 and the elevation at day 70 when clone 13 infected (gray bars) were compared to Armstrong infected (black bars) mice. Data are represented as the mean ± SD. Asterisks denote statistically significant (p < 0.05) differences between Armstrong and clone 13 infected mice. E) The absolute number of CD8+Thy1.1+ P14 cells (open circles) in the CNS of clone 13 infected animals (as shown in panel C) is plotted against the titer of infectious virus (black circles) in the brain at various time points after clone 13 infection (as shown in Table 1). Note that the elevation in CNS CTL numbers coincides with a reduction in infectious virus as determined by plaque assay.
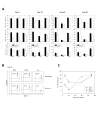
Figure 5
Analysis of CTL function during clone 13 persistence. A) Mononuclear cells were extracted from the spleen, liver and CNS of Armstrong (black bars) or clone 13 (white bars) infected mice (n = 3 mice per group) at the denoted time points. Following a 5 hr in vitro stimulation with GP33–41 peptide, P14 cells were examined flow cytometrically for the production of IFN-γ (top row), TNF-α (middle row) and IL-2 (lower row). Note that when compared to the P14 cells in the spleen and liver, an intermediate state of P14 functional exhaustion was observed in the CNS. This was most prominent at day 20 p.i. P14 cells in all compartments regained complete functionality by day 90 p.i. Each bar represents the mean ± SD. Statistical differences between Armstrong and clone 13 infected mice are denoted by asterisks (p < 0.05). B) Representative dot plots used to generate the bar graphs in panel A are shown for CNS P14 cytokine production at day 20 p.i. This time point was selected to show the relative preservation of CNS P14 function at a time point when functional exhaustion was most severe in the spleen and liver. Dot plots are gated on CD45+CD8+Thy1.1+ P14 cells, and the numbers indicate the frequency of P14 cells that produce the denoted cytokines. C) The relative loss in P14 function was calculated by dividing the frequency of TNF-α producing P14 cells (as shown in panel A) from the CNS, spleen, and liver of clone 13 infected mice by the frequency observed in Armstrong infected mice. This number was multiplied by 100 to generate percentages. Note the relative preservation of P14 function in the CNS when compared to peripheral tissues. Double asterisks (**) denote a statistically significant difference (p < 0.05) between the CNS and spleen as well as the CNS and liver. A single asterisk (*) denotes a statistically significant difference (p < 0.05) between the CNS and spleen only.
Figure 6
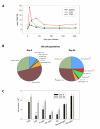
Diversification in the CNS immune repertoire during the reanimation phase. A) The CD8 to CD4 T cell ratio was calculated for spleen, liver, and CNS of clone 13 infected mice over time by dividing the absolute number of CD8 T cells extracted from each tissue by the absolute number of CD4 T cells. Note that the ratio is highest in the CNS at early time points post-infection. As the number of CD4 T cells increase in the CNS over time this ratio becomes similar to that observed in peripheral tissues. B) Mononuclear cells were extracted from spleen (data not shown), liver (data not shown) and CNS of clone 13 infected mice (n = 4 mice per group) at day 8 (exhaustion phase) or day 69 (reanimation phase) p.i. to define the immune repertoire. Multi-parameter digital flow cytometry permitted analysis of the entire immune repertoire from a single sample for each tissue. The frequencies of both innate and adaptive immune cells are represented as pie diagrams. Statistically significant increases (p < 0.05) at day 69 are denoted by asterisks. C) The frequencies shown in panel B were used to calculate the absolute number of the respective CNS cell populations in clone 13 infected mice. Note the statistically significant (p < 0.05) increase in the number of CD4 T cells and B cells in the CNS at day 69. The bars represent mean ± SD at each time point. Asterisks denote a statistically significant difference between day 8 and day 69.
Similar articles
- Alcohol intake alters immune responses and promotes CNS viral persistence in mice.
Loftis JM, Taylor J, Raué HP, Slifka MK, Huang E. Loftis JM, et al. Behav Brain Res. 2016 Oct 1;312:1-8. doi: 10.1016/j.bbr.2016.06.006. Epub 2016 Jun 4. Behav Brain Res. 2016. PMID: 27269869 Free PMC article. - Differential tissue-specific regulation of antiviral CD8+ T-cell immune responses during chronic viral infection.
Zhou S, Ou R, Huang L, Price GE, Moskophidis D. Zhou S, et al. J Virol. 2004 Apr;78(7):3578-600. doi: 10.1128/jvi.78.7.3578-3600.2004. J Virol. 2004. PMID: 15016881 Free PMC article. - Protection of CD3 delta knockout mice from lymphocytic choriomeningitis virus-induced immunopathology: implications for viral neuroinvasion.
Kappes DJ, Lawrence DM, Vaughn MM, Davé VP, Belman AR, Rall GF. Kappes DJ, et al. Virology. 2000 Apr 10;269(2):248-56. doi: 10.1006/viro.2000.0224. Virology. 2000. PMID: 10753703 - Understanding Experimental LCMV Infection of Mice: The Role of Mathematical Models.
Bocharov G, Argilaguet J, Meyerhans A. Bocharov G, et al. J Immunol Res. 2015;2015:739706. doi: 10.1155/2015/739706. Epub 2015 Oct 21. J Immunol Res. 2015. PMID: 26576439 Free PMC article. Review. - Virus-neuron-cytotoxic T lymphocyte interactions.
Rall GF, Oldstone MB. Rall GF, et al. Curr Top Microbiol Immunol. 1995;202:261-73. doi: 10.1007/978-3-642-79657-9_17. Curr Top Microbiol Immunol. 1995. PMID: 7587367 Review. No abstract available.
Cited by
- Transforming growth factor-β signaling controls the formation and maintenance of gut-resident memory T cells by regulating migration and retention.
Zhang N, Bevan MJ. Zhang N, et al. Immunity. 2013 Oct 17;39(4):687-96. doi: 10.1016/j.immuni.2013.08.019. Epub 2013 Sep 26. Immunity. 2013. PMID: 24076049 Free PMC article. - BST-2 controls T cell proliferation and exhaustion by shaping the early distribution of a persistent viral infection.
Urata S, Kenyon E, Nayak D, Cubitt B, Kurosaki Y, Yasuda J, de la Torre JC, McGavern DB. Urata S, et al. PLoS Pathog. 2018 Jul 20;14(7):e1007172. doi: 10.1371/journal.ppat.1007172. eCollection 2018 Jul. PLoS Pathog. 2018. PMID: 30028868 Free PMC article. - Infection in the Developing Brain: The Role of Unique Systemic Immune Vulnerabilities.
Singh G, Tucker EW, Rohlwink UK. Singh G, et al. Front Neurol. 2022 Jan 24;12:805643. doi: 10.3389/fneur.2021.805643. eCollection 2021. Front Neurol. 2022. PMID: 35140675 Free PMC article. Review. - Therapeutic blockade of transforming growth factor beta fails to promote clearance of a persistent viral infection.
Garidou L, Heydari S, Gossa S, McGavern DB. Garidou L, et al. J Virol. 2012 Jul;86(13):7060-71. doi: 10.1128/JVI.00164-12. Epub 2012 May 2. J Virol. 2012. PMID: 22553324 Free PMC article. - Adaptive immune response to viral infections in the central nervous system.
Libbey JE, Fujinami RS. Libbey JE, et al. Handb Clin Neurol. 2014;123:225-47. doi: 10.1016/B978-0-444-53488-0.00010-9. Handb Clin Neurol. 2014. PMID: 25015488 Free PMC article.
References
- Doherty PC, Zinkernagel RM. T-cell-mediated immunopathology in viral infections. Transplant Rev. 1974;19:89–120. - PubMed
Publication types
MeSH terms
Grants and funding
- P30 MH062261/MH/NIMH NIH HHS/United States
- AI070967-01/AI/NIAID NIH HHS/United States
- R01 AI070967/AI/NIAID NIH HHS/United States
- MH062261-06/MH/NIMH NIH HHS/United States
- R21 NS048866/NS/NINDS NIH HHS/United States
- NS048866-01/NS/NINDS NIH HHS/United States
LinkOut - more resources
Full Text Sources
Research Materials
