HIV-1 DNA Flap formation promotes uncoating of the pre-integration complex at the nuclear pore - PubMed (original) (raw)
HIV-1 DNA Flap formation promotes uncoating of the pre-integration complex at the nuclear pore
Nathalie J Arhel et al. EMBO J. 2007.
Abstract
The HIV-1 central DNA Flap acts as a cis-acting determinant of HIV-1 genome nuclear import. Indeed, DNA-Flap re-insertion within lentiviral-derived gene transfer vectors strongly stimulates gene transfer efficiencies. In this study, we sought to understand the mechanisms by which the central DNA Flap mediates HIV-1 nuclear import. Here, we show that reverse transcription (RT degrees) occurs within an intact capsid (CA) shell, independently of the routing process towards the nuclear membrane, and that uncoating is not an immediate post-fusion event, but rather occurs at the nuclear pore upon RT degrees completion. We provide the first observation with ultrastructural resolution of intact intracellular HIV-1 CA shells by scanning electron microscopy. In the absence of central DNA Flap formation, uncoating is impaired and linear DNA remains trapped within an integral CA shell precluding translocation through the nuclear pore. These data show that DNA Flap formation, the very last event of HIV-1 RT degrees, acts as a viral promoting element for the uncoating of HIV-1 at the nuclear pore.
Figures
Figure 1
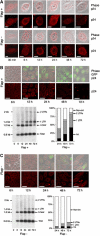
Disappearance of CA proteins at the nuclear membrane correlates in time with nuclear entry of linear vector DNA. (A) Fluorescence confocal microscopy images of incoming CA proteins with time following transduction. P4 cells were transduced with TRIP Flap+ vector, HR Flap− vector. Lower panels show p24 staining and upper panels merge images of p24 staining with phase contrast. The thickness of confocal images is 0.8 μm. Scale bars=3 μm. (B and C) Correlated Southern blotting and immunofluorescence studies. Bottom left-hand panels show intracellular vector DNA profiles following transduction by Southern blot analysis using a vector-specific probe (Zennou et al, 2000). P4 cells were transduced with equal amounts of TRIP-GFP (B) or HR-GFP (C) vector normalized on p24 contents of the supernatants. Bottom right-hand panels show the phosphorimager quantification of intracellular vector DNA forms expressed as percentage of total vector DNA (Zennou et al, 2000). Upper images are the immunofluorescence images (merge of 4 confocal slices) obtained in parallel of the Southern analysis, showing p24 staining and a merge of p24 staining, phase contrast, and GFP expression. Scale bars=10 μm.
Figure 2
Inhibition of HIV-1 RT° does not perturb routing to the nuclear membrane but results in stable perinuclear accumulation of viral CA. P4 cells were transduced with TRIP-GFP Flap+ vector in the presence or absence of 1 μM nevirapine, or were left nontransduced as control. Immunofluorescence images are a merge of four confocal stacks showing p24(CA) staining at 48 h p.i. Scale bar=5 μm.
Figure 3
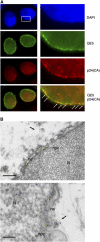
Detection by TEM of integral HIV-1 capsids at the cytoplasmic face of the nuclear pore. (A) Fluorescence confocal images of P4 cells 72 h p.i with an HR-Luc vector. Nuclei are visualized with DAPI staining. Nuclear pores are labeled with mouse monoclonal QE5 antibody (kind gift from Dr U Aebi), which recognizes CAN/Nup214, p62, and p153. CA is labeled using a polyclonal anti-p24 antibody. Right-hand panels are greater magnifications of the boxed area. Arrows point to points of colocalization between p24(CA) and NPCs. Scale bars=3 μm (left-hand panels) and 500 nm (right-hand panels). (B) MT4 cells were infected with cPPT-225T virus and nuclei were isolated 48 h p.i. Upper panel: ultrastructure image showing a capsid-like structure at close proximity of the nuclear membrane and two nuclear pores. Lower panel: immunogold staining with anti-p24(CA) antibodies (gold beads=1 nm) confirms the viral nature of the capsid. N, nucleus; ne, nuclear envelope; npc, nuclear pore complex. Scale bars=100 nm.
Figure 4
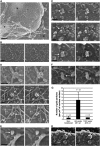
Surface imaging of nuclei by SEM following transduction or infection leads to detection of intact vector and viral capsids at close proximity of nuclear pores. (A) Cytoplasmic extraction of P4 cells in situ exposes nuclear pores and cytoskeletal remnants. C, remnant cytoplasm; N, nucleus; F, cytoskeletal filaments. (B) Control noninfected cells. (C, D) At 48 h p.i with the HR Flap− vector. (E) At 48 h p.i with Flap-defective cPPT-225T mutant virus. (F) At 12 h p.i with the TRIP Flap+ vector. Left panels show secondary electron surface imaging alone, and right panels the backscattered gold signal (anti-p24(CA) labeling) superimposed (Supplementary Figure 2 shows original backscatter images). Arrows point to viral capsids, whereas lines pinpoint key NPC and actin filaments (af). (G) Quantification of p24(CA) staining at the nuclear membrane 48 h p.i with either HR Flap− or TRIP Flap+ vectors, or noninfected. Quantification was carried out on five or more separate nuclei from three independent sample preparations. Capsids were readily detected at late time points p.i in the absence of the central DNA flap, but only at early time points in the presence of the DNA flap. (H) Surface imaging of nuclei by SEM 48 h p.i with LAI-vsv wild-type virus in the presence of nevirapine. Scale bars=1 μm for (A), 200 nm for (B), and 100 nm for all other image panels.
Figure 5
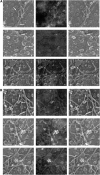
SEM imaging of nuclei at late time points p.i reveals CA debris in Flap+ samples and integral CA shells in Flap− samples. Images show nuclear surfaces in transduced cells 48 h p.i with (A) the TRIP Flap+ vector and (B) the HR flap− vector. The figure shows secondary electron surface imaging alone (left panels), original corresponding backscattered gold signals (anti-p24(CA) labeling, central panels), and the two superimposed (with artificial highlighting of gold signal, right panels). Arrows point to CA debris in (A), and to intact HIV-1 vector capsids in (B). Scale bars=200 nm.
Figure 6
Detection of capsid-like structures at proximity of nuclear pores by cryo SEM. P4 cells were transduced with HR Flap− vector and prepared by cryo-fixation 48 h p.i. (A) Negative control. (B) HR-transduced cells. Preparation of samples by cryo-fixation reveals capsids with typical conical morphology at close proximity of nuclear pores. Arrows indicate capsid-like structures of typical morphology, and lines point to adjacent NPCs. Supplementary Figure 3 provides an outlining of these structures with artificial coloring. Scale bars=100 nm.
Figure 7
ERT and uncoating assay shows increased vector capsid uncoating upon successful central DNA Flap formation. (A) ERT was carried out on vector supernatants, and qPCR was used to quantify late RT° products and early minus strong stop DNA ((−)ssDNA) products (upper panel). The qPCR quantification was carried out in triplicate and is highly representative of nine independent experiments carried out on three distinct vector productions. ERT reactions were then layered onto sucrose cushion to isolate monomeric CA proteins, indicative of productive uncoating, which were quantified by p24 ELISA assay (lower panel). The p24 ELISA quantification is represented as a percentage of monomeric CA obtained for the corresponding Triton X-100-treated vector samples (% uncoating), and is a mean of three independent experiments carried out on three distinct vector productions, representative of five independent experiments. (B) Southern blotting using a vector specific probe was used to monitor the presence of full-length reverse-transcribed products in the ERT reactions compared with Hirt samples. The radiograph shown is representative of three independent experiments. (C) Formation of the central DNA Flap in Flap+ samples was assessed by dC-tailing of the 3′ (+) strand overlap followed by qPCR using primers specific for the ter2-dCtail region and a 5′ region ∼200 bp upstream (upper panel). The number of copies of dC-tailed amplified products is represented as a percentage of late RT° products (lower panel). The quantification was carried out in triplicate and is highly representative of five independent experiments.
Figure 8
HIV-1 viral genomes lacking the central DNA Flap are trapped within integral capsids at the cytoplasmic face of the nuclear membrane. MT4 lymphocytes were infected with cPPT-225T replicative virus and fixed at the peak of infection. The protocol was carried out without the usual protease treatment to preserve ultrastructures. (A) viral DNA was revealed by in situ hybridization using a virus-specific probe (Zennou et al, 2000; gold beads=10 nm). (B) Co-detection of viral DNA (gold beads=10 nm) with p24(CA) signal by immunogold labeling (gold beads=5 nm). Right-hand images are greater magnifications of the boxed areas in left-hand images. Arrows point to viral genomes. Scale bars=1 μm (left images) and 100 nm (right images). N, nucleus; ne, nuclear envelope.
Figure 9
An updated model for HIV-1 intracellular transport and DNA Flap-dependent nuclear import. (1) HIV-1 viruses enter target cells by receptor-mediated fusion and need to cross and/or interact with the actin cortex underlying the plasma membrane for productive infection to take place (Campbell et al, 2004). Post-fusion uncoating does not take place at this stage. (2) HIV-1 RTCs proceeding directly from the core of the particle undergo rapid and saltatory microtubule-directed movement towards the nuclear compartment (McDonald et al, 2002; Arhel et al, 2006b). (3) RTCs undergo transition from microtubules onto actin filaments at close proximity to the nuclear compartment and then (4) slow actin-directed movements towards the nuclear membrane (Arhel et al, 2006b). (5) HIV-1 CAs containing viral genome dock at NPCs. Interaction with cytoplasmic filaments emanating from NPCs is hypothetical. (6) As docking of RTCs at the nuclear pore is more rapid than RT°, we surmise that most of viral DNA synthesis occurs within an integral CA core docked at the NPC. Upon RT° completion and formation of the central DNA Flap, which is consequent upon the final strand displacement event, (7) docked RTCs can undergo DNA-Flap-dependent maturation, leading to PIC formation lacking the CA shell. Complexes that lack DNA Flap formation accumulate within intact HIV-1 CAs that forbid translocation through the nuclear pore. (8) The HIV-1 PIC is translocated through the nuclear pore. The folded structure of the PIC via integrase dimerization is hypothetical (Zennou et al, 2000). (9) The HIV-1 PIC undergoes a poorly characterized diffusive intranuclear transport (Arhel et al, 2006b) and (10) either integrates into host cell chromatin or circularizes into 1- or 2-LTR circles.
Similar articles
- Wild-type and central DNA flap defective HIV-1 lentiviral vector genomes: intracellular visualization at ultrastructural resolution levels.
Arhel NJ, Souquere-Besse S, Charneau P. Arhel NJ, et al. Retrovirology. 2006 Jun 26;3:38. doi: 10.1186/1742-4690-3-38. Retrovirology. 2006. PMID: 16800894 Free PMC article. - Cone-shaped HIV-1 capsids are transported through intact nuclear pores.
Zila V, Margiotta E, Turoňová B, Müller TG, Zimmerli CE, Mattei S, Allegretti M, Börner K, Rada J, Müller B, Lusic M, Kräusslich HG, Beck M. Zila V, et al. Cell. 2021 Feb 18;184(4):1032-1046.e18. doi: 10.1016/j.cell.2021.01.025. Epub 2021 Feb 10. Cell. 2021. PMID: 33571428 Free PMC article. - Nuclear Import of HIV-1.
Shen Q, Wu C, Freniere C, Tripler TN, Xiong Y. Shen Q, et al. Viruses. 2021 Nov 8;13(11):2242. doi: 10.3390/v13112242. Viruses. 2021. PMID: 34835048 Free PMC article. Review. - HIV-1 Uncoating and Nuclear Import Precede the Completion of Reverse Transcription in Cell Lines and in Primary Macrophages.
Francis AC, Marin M, Prellberg MJ, Palermino-Rowland K, Melikyan GB. Francis AC, et al. Viruses. 2020 Oct 30;12(11):1234. doi: 10.3390/v12111234. Viruses. 2020. PMID: 33143125 Free PMC article. - Nuclear Capsid Uncoating and Reverse Transcription of HIV-1.
Müller TG, Zila V, Müller B, Kräusslich HG. Müller TG, et al. Annu Rev Virol. 2022 Sep 29;9(1):261-284. doi: 10.1146/annurev-virology-020922-110929. Epub 2022 Jun 15. Annu Rev Virol. 2022. PMID: 35704745 Review.
Cited by
- Daxx Inhibits HIV-1 Reverse Transcription and Uncoating in a SUMO-Dependent Manner.
Maillet S, Fernandez J, Decourcelle M, El Koulali K, Blanchet FP, Arhel NJ, Maarifi G, Nisole S. Maillet S, et al. Viruses. 2020 Jun 11;12(6):636. doi: 10.3390/v12060636. Viruses. 2020. PMID: 32545337 Free PMC article. - Reverse Transcription of Retroviruses and LTR Retrotransposons.
Hughes SH. Hughes SH. Microbiol Spectr. 2015 Apr;3(2):MDNA3-0027-2014. doi: 10.1128/microbiolspec.MDNA3-0027-2014. Microbiol Spectr. 2015. PMID: 26104704 Free PMC article. Review. - The importance of becoming double-stranded: Innate immunity and the kinetic model of HIV-1 central plus strand synthesis.
Poeschla E. Poeschla E. Virology. 2013 Jun 20;441(1):1-11. doi: 10.1016/j.virol.2013.03.010. Epub 2013 Apr 3. Virology. 2013. PMID: 23561461 Free PMC article. Review. - Virus-producing cells determine the host protein profiles of HIV-1 virion cores.
Santos S, Obukhov Y, Nekhai S, Bukrinsky M, Iordanskiy S. Santos S, et al. Retrovirology. 2012 Aug 13;9:65. doi: 10.1186/1742-4690-9-65. Retrovirology. 2012. PMID: 22889230 Free PMC article. - How HIV takes advantage of the cytoskeleton in entry and replication.
Stolp B, Fackler OT. Stolp B, et al. Viruses. 2011 Apr;3(4):293-311. doi: 10.3390/v3040293. Epub 2011 Mar 28. Viruses. 2011. PMID: 21994733 Free PMC article. Review.
References
- Allen TD, Rutherford SA, Bennion GR, Wiese C, Riepert S, Kiseleva E, Goldberg MW (1998) Three-dimensional surface structure analysis of the nucleus. In Nuclear Structure and Function. Berrios M (ed), pp 125–138. San Diego, CA: Academic Press - PubMed
- Arhel NJ, Genovesio G, Kim KA, Miko S, Perret E, Olivo-Marin JC, Shorte S, Charneau P (2006b) Quantitative 4D trascking of cytoplasmic and nuclear HIV-1 complexes. Nat Meth 3: 817–824 - PubMed
Publication types
MeSH terms
Substances
LinkOut - more resources
Full Text Sources
Other Literature Sources


