The power of single and multibeam two-photon microscopy for high-resolution and high-speed deep tissue and intravital imaging - PubMed (original) (raw)
The power of single and multibeam two-photon microscopy for high-resolution and high-speed deep tissue and intravital imaging
Raluca Niesner et al. Biophys J. 2007.
Abstract
Two-photon microscopy is indispensable for deep tissue and intravital imaging. However, current technology based on single-beam point scanning has reached sensitivity and speed limits because higher performance requires higher laser power leading to sample degradation. We utilize a multifocal scanhead splitting a laser beam into a line of 64 foci, allowing sample illumination in real time at full laser power. This technology requires charge-coupled device field detection in contrast to conventional detection by photomultipliers. A comparison of the optical performance of both setups shows functional equivalence in every measurable parameter down to penetration depths of 200 microm, where most actual experiments are executed. The advantage of photomultiplier detection materializes at imaging depths >300 microm because of their better signal/noise ratio, whereas only charge-coupled devices allow real-time detection of rapid processes (here blood flow). We also find that the point-spread function of both devices strongly depends on tissue constitution and penetration depth. However, employment of a depth-corrected point-spread function allows three-dimensional deconvolution of deep-tissue data up to an image quality resembling surface detection.
Figures
FIGURE 1
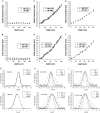
Dependence of the spatial (lateral and axial) resolution on the penetration depth measured in (A and B) agarose, (C and D) brain tissue, and (E and F) lymph nodes with both the single-beam PMT and the multibeam CCD setup. Typical lateral and axial profiles of experimental ePSF are shown in three different depths for (G) agarose, (H) brain tissue, and (I) lymph node. The ePSF were measured using green fluorescent beads (emission maximum 515 nm) excited at 800 nm. Each value of the spatial resolution was calculated as the average over 6–15 data points.
FIGURE 2
Dependence of the spatial resolution on the penetration depth in lymph nodes and in brain slice regions containing axons and somata, respectively. The ePSF experiments were performed with green fluorescent beads (emission maximum 515 nm) using the multibeam CCD setup at 800 nm excitation wavelength. Images show representative pictures of brain slices from Thy-1-EYFP transgenic animals or lymph nodes from wt animals where red and green leukocytes had been adoptively transferred before imaging. Please note the abundance of cell bodies in lymph nodes (either from transferred red or green cells or from endogenous autofluorescent cells) and brain regions with somata, whereas axon-rich brain areas display a relatively low number of (black, i.e., EYFP-negative) cell bodies.
FIGURE 3
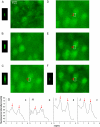
Deconvolution with depth-dependent ePSF allows restoration of images from deep tissue layers to the quality level of surface data. Fluorescence images of a 78-_μ_m-thick brain slice and corresponding xz cross sections of the in situ measured ePSF: (A) at the surface, (B) in 37 _μ_m depth, and (C) in 75 _μ_m depth. (D) Three-dimensional deconvolved image of C using the ePSF measured at the surface (identical to the ePSF measured in agarose). (E) Three-dimensional deconvolution of C using the ePSF measured in 75-_μ_m depth. (F) The same layer as C but imaged from the other side of the brain slice, i.e., through a brain tissue layer of only 3 _μ_m thickness. The diagrams G, H, I, and J represent intensity profiles along a line through the two bright spots indicated by red arrows in the images C–F. For optimal deconvolution, the heights of maxima as well as height of the minimum have to be as close as possible to the “perfect” image in F. The experiments were performed using the multibeam CCD setup at an excitation wavelength of 800 nm. The _z_-step between two consecutive optical slices was 500 nm.
FIGURE 4
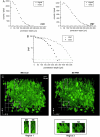
(A) Dependence of the fluorescence signal and of the background noise on the penetration depth measured with the multibeam CCD or single-beam PMT setup. Because of the truncation of the PSF at the sample surface, the fluorescence signal in this depth is lower than that at 20 _μ_m depth. (B) Dependence of the SNR on the penetration depth. The _z_-step between two consecutive optical slices was 2 _μ_m (imaged region 300 × 300 _μ_m2). (C) Comparison between the multibeam CCD and the single-beam PMT setup on the example of a three-dimensional reconstruction of an EYFP brain slice region. A Thy-1-EYFP brain slice of 166 _μ_m thickness was imaged either with the multifocal CCD or the single-beam PMT setup and subsequently voxel-rendered with a 1-_μ_m _z_-spacing. The small images show zoomed views of two identical regions in both stacks, revealing almost identical optical performance and content. The excitation wavelength was 920 nm in all experiments.
FIGURE 5
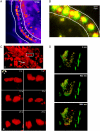
Imaging blood flow in mice in real time with a multibeam CCD setup. Dual-color images were detected simultaneously with two independent CCD cameras based on color splitting by a 570-nm-cutoff dichroic mirror. (A) Time projection over 11 single-color two-dimensional fluorescence images of a blood vessel and surrounding tissue stained by i.v. injection of Rhodamine-6G. The time delay between two consecutive numbers was 50 ms. Shown is a cell doublet rolling on the surface of the vessel (white outlines). Images were taken from movies 1 and 2. (B) Time projection of 11 dual-color two-dimensional fluorescence images of a blood vessel (white outlines) stained with Rhodamine 6G (yellow). Spleen cells previously stained either with CFSE (green) or CTO (red) and additionally injected into the mouse are represented green and red, respectively, because they were detected by only one of the two CCD cameras. The fact that blood cells stained with Rhodamine-6G only appear yellow indicates their simultaneous detection in both cameras and thus proves the synchronicity of the system. The green numbers indicate the position of a CFSE-stained cell at six different time points, whereas the red numbers indicate the position of a CTO-stained cell at five subsequent time points. The time delay between two consecutive numbers is 50 ms. Images were taken from movies 5 and 6. (C I) Three-dimensional visualization of the fluorescence of a blood vessel and surrounding tissue-resident cells, which were stained with Rhodamine 6G as described above. (C II) Image series representing the two cells framed in C I at six different time points during a 180° rotation around the x axis. The _z_-stacks used for the three-dimensional representation contained 21 frames each, separated by 1 _μ_m. Time delay between two consecutive _z_-stacks was 5 s. Images were taken from movies 3 and 4. (D) Three-dimensional representations of the dual-color fluorescence of a blood vessel in a mouse prepared as described above at three different time points. The time delay between two consecutive _z_-stacks was 800 ms. The _z_-stacks used for the three-dimensional representations contained 16 frames each, separated by 2 _μ_m. Images were taken from movie 7. In all experiments: minimum exposure time = 28 ms, excitation wavelength = 800 nm. The minimum delay between two consecutive images was limited by the readout time of the CCD chip.
Similar articles
- Intravital two-photon microscopy: focus on speed and time resolved imaging modalities.
Niesner RA, Andresen V, Gunzer M. Niesner RA, et al. Immunol Rev. 2008 Feb;221:7-25. doi: 10.1111/j.1600-065X.2008.00582.x. Immunol Rev. 2008. PMID: 18275472 - Resolution enhancement of two-photon microscopy via intensity-modulated laser scanning structured illumination.
Yeh CH, Chen SY. Yeh CH, et al. Appl Opt. 2015 Mar 20;54(9):2309-17. doi: 10.1364/AO.54.002309. Appl Opt. 2015. PMID: 25968516 - Image scanning microscopy with multiphoton excitation or Bessel beam illumination.
Sheppard CJR, Castello M, Tortarolo G, Slenders E, Deguchi T, Koho SV, Vicidomini G, Diaspro A. Sheppard CJR, et al. J Opt Soc Am A Opt Image Sci Vis. 2020 Oct 1;37(10):1639-1649. doi: 10.1364/JOSAA.402048. J Opt Soc Am A Opt Image Sci Vis. 2020. PMID: 33104611 - Two-photon excitation of fluorescence for three-dimensional optical imaging of biological structures.
Diaspro A, Robello M. Diaspro A, et al. J Photochem Photobiol B. 2000 Mar;55(1):1-8. doi: 10.1016/s1011-1344(00)00028-2. J Photochem Photobiol B. 2000. PMID: 10877060 Review. - Two-photon microscopy of deep intravital tissues and its merits in clinical research.
Wang BG, König K, Halbhuber KJ. Wang BG, et al. J Microsc. 2010 Apr 1;238(1):1-20. doi: 10.1111/j.1365-2818.2009.03330.x. J Microsc. 2010. PMID: 20384833 Review.
Cited by
- Quantification of multiphoton and fluorescence images of reproductive tissues from a mouse ovarian cancer model shows promise for early disease detection.
Sawyer TW, Koevary JW, Rice FPS, Howard CC, Austin OJ, Connolly DC, Cai KQ, Barton JK. Sawyer TW, et al. J Biomed Opt. 2019 Sep;24(9):1-16. doi: 10.1117/1.JBO.24.9.096010. J Biomed Opt. 2019. PMID: 31571434 Free PMC article. - Simultaneous high-speed imaging and optogenetic inhibition in the intact mouse brain.
Bovetti S, Moretti C, Zucca S, Dal Maschio M, Bonifazi P, Fellin T. Bovetti S, et al. Sci Rep. 2017 Jan 5;7:40041. doi: 10.1038/srep40041. Sci Rep. 2017. PMID: 28053310 Free PMC article. - A portable laser photostimulation and imaging microscope.
Nikolenko V, Peterka DS, Yuste R. Nikolenko V, et al. J Neural Eng. 2010 Aug;7(4):045001. doi: 10.1088/1741-2560/7/4/045001. Epub 2010 Jul 19. J Neural Eng. 2010. PMID: 20644244 Free PMC article. - Altered cellular dynamics and endosteal location of aged early hematopoietic progenitor cells revealed by time-lapse intravital imaging in long bones.
Köhler A, Schmithorst V, Filippi MD, Ryan MA, Daria D, Gunzer M, Geiger H. Köhler A, et al. Blood. 2009 Jul 9;114(2):290-8. doi: 10.1182/blood-2008-12-195644. Epub 2009 Apr 8. Blood. 2009. PMID: 19357397 Free PMC article. - Longitudinal imaging of T cell-based immunotherapy with multi-spectral, multi-scale optoacoustic tomography.
Kimm MA, Tzoumas S, Glasl S, Omar M, Symvoulidis P, Olefir I, Rummeny EJ, Meier R, Ntziachristos V. Kimm MA, et al. Sci Rep. 2020 Mar 17;10(1):4903. doi: 10.1038/s41598-020-61191-z. Sci Rep. 2020. PMID: 32184401 Free PMC article.
References
- Lichtman, J. W., and J. A. Conchello. 2005. Fluorescence microscopy. Nat. Methods. 2:910–919. - PubMed
- Sumen, C., T. R. Mempel, I. B. Mazo, and U. H. von Andrian. 2004. Intravital microscopy; visualizing immunity in context. Immunity. 21:315–329. - PubMed
- von Andrian, U. H., and C. M'Rini. 1998. In situ analysis of lymphocyte migration to lymph nodes. Cell Adhes. Commun. 6:85–96. - PubMed
- Halin, C., M. J. Rodrigo, C. Sumen, and U. H. von Andrian. 2005. In vivo imaging of lymphocyte trafficking. Annu. Rev. Cell Dev. Biol. 21:581–603. - PubMed
- Gunzer, M., C. Weishaupt, A. Hillmer, Y. Basoglu, P. Friedl, K. E. Dittmar, W. Kolanus, G. Varga, and S. Grabbe. 2004. A spectrum of biophysical interaction modes between T cells and different antigen presenting cells during priming in 3-D collagen and in vivo. Blood. 104:2801–2809. - PubMed
Publication types
MeSH terms
Substances
LinkOut - more resources
Full Text Sources
Other Literature Sources


